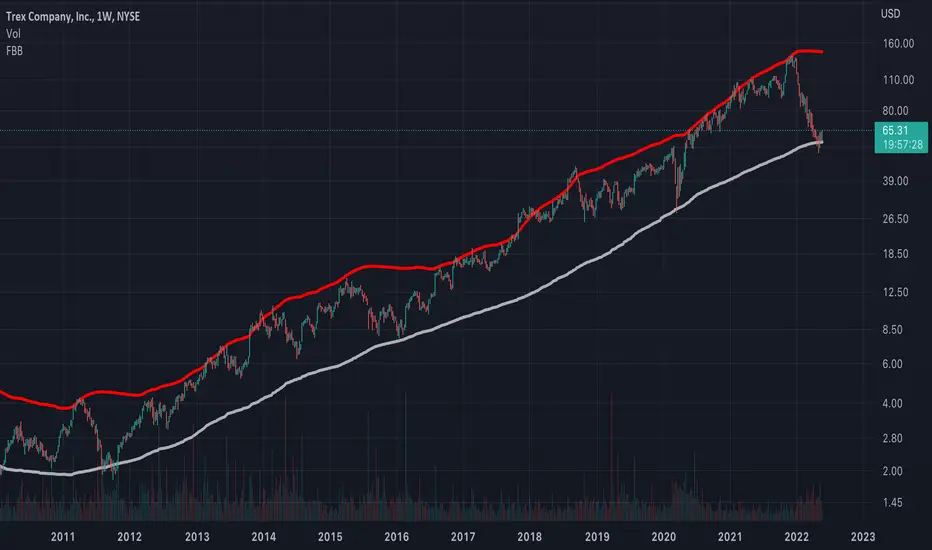
The weekly chart for TREX shows that price appears to remain bounded by the upper band (red) and basis (white) of the Fibonacci Bollinger Bands as it has since the Great Recession. The price is looking ready for a bounce. The oscillators are too oversold on the monthly chart to support a high probability that TREX will drop sharply below the white level. Therefore this price area represents a rather low-risk buying setup.
Not financial advice. As always anything can happen and trends can end.
Not financial advice. As always anything can happen and trends can end.
To support my work:
patreon.com/SpyMasterTrades
To subscribe to my YouTube channel:
youtube.com/@SpyMasterTrades
To follow me on X:
twitter.com/SpyMasterTrades
To tip me (BTC wallet):
bc1qvh48429042mdwvdthwlufx072g3ftffcts2q03
patreon.com/SpyMasterTrades
To subscribe to my YouTube channel:
youtube.com/@SpyMasterTrades
To follow me on X:
twitter.com/SpyMasterTrades
To tip me (BTC wallet):
bc1qvh48429042mdwvdthwlufx072g3ftffcts2q03
Declinazione di responsabilità
Le informazioni e le pubblicazioni non sono intese come, e non costituiscono, consulenza o raccomandazioni finanziarie, di investimento, di trading o di altro tipo fornite o approvate da TradingView. Per ulteriori informazioni, consultare i Termini di utilizzo.