Tesla (
🔍 Key Technical Developments:
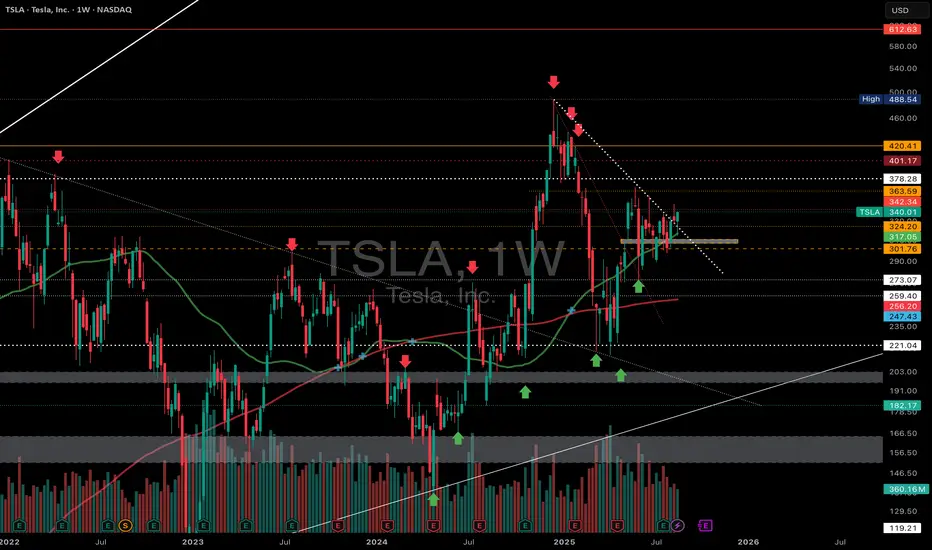
• Break of Downtrend: Price broke above the descending trendline (dotted white) that had been rejecting rallies since the $488 peak. This breakout was followed by consolidation just above support.
• Support Zone: The $320–$325 region (highlighted box) has been tested multiple times and is now acting as a solid demand area.
• Moving Averages: TSLA is holding above both the 50 day (green) and 200-day (red) MAs bullish posture.
• Trend Reversal Structure: Higher lows forming since April 2025, supported by increasing volume on up moves a constructive bullish base.
📌 Key Levels to Watch:
• Resistance:
◦ $342.34 (current test)
◦ $363.59 (next major level)
◦ $378.28 and $401.17 as higher resistance zones
• Support:
◦ $324.20 / $321.84
◦ $301.76
◦ Below that: $273.07
📈 Current Price: $340.01 (+6.22%)
Tesla is attempting to break out of a long-term downtrend structure. A sustained move above $342–$344 could ignite momentum toward $360+.
📊 Watch for volume confirmation and reaction at major resistance zones.
#Tesla #TSLA #Stocks #TechnicalAnalysis #Breakout #ElonMusk #Trading #NASDAQ
Declinazione di responsabilità
Le informazioni e le pubblicazioni non sono intese come, e non costituiscono, consulenza o raccomandazioni finanziarie, di investimento, di trading o di altro tipo fornite o approvate da TradingView. Per ulteriori informazioni, consultare i Termini di utilizzo.
Declinazione di responsabilità
Le informazioni e le pubblicazioni non sono intese come, e non costituiscono, consulenza o raccomandazioni finanziarie, di investimento, di trading o di altro tipo fornite o approvate da TradingView. Per ulteriori informazioni, consultare i Termini di utilizzo.