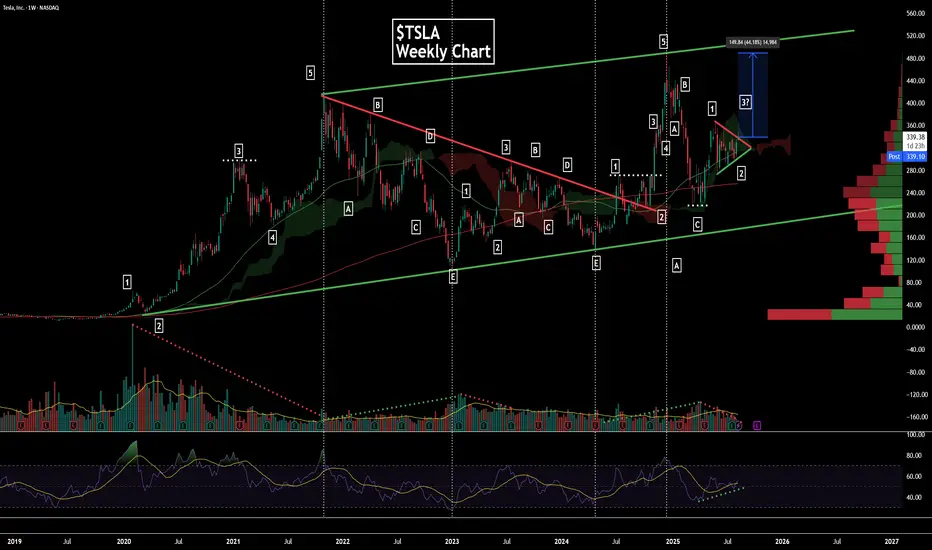
Since 2019,  TSLA has been trending within a long-term bullish channel. From 2019 to Jan 2023, price completed a 5-wave Elliott impulse sequence, with each impulse wave showing bearish volume divergence — confirming volume peaks and overbought RSI conditions into the Oct ’21 top.
This was followed by a retracement triangle, kicking off a 3-year corrective phase in a 5-3-5 Elliott retracement structure. The impulsive down legs were accompanied by rising volume, while the corrective bounces saw declining volume. The final bearish wave showed exhaustion, with bullish divergence emerging via stable-to-rising volume and a flattening RSI.
An 8-wave Elliott fractal then formed, with volume alignment, ending at a $222 support zone — confluencing with peak volume and a historically oversold RSI. From here, price formed a bull pennant and has since broken above resistance, albeit on weak volume — suggesting possible whipsaw risk.
If price closes firmly above resistance, the next leg could target the upper channel near $488.
Declinazione di responsabilità
Le informazioni ed i contenuti pubblicati non costituiscono in alcun modo una sollecitazione ad investire o ad operare nei mercati finanziari. Non sono inoltre fornite o supportate da TradingView. Maggiori dettagli nelle Condizioni d'uso.
Declinazione di responsabilità
Le informazioni ed i contenuti pubblicati non costituiscono in alcun modo una sollecitazione ad investire o ad operare nei mercati finanziari. Non sono inoltre fornite o supportate da TradingView. Maggiori dettagli nelle Condizioni d'uso.