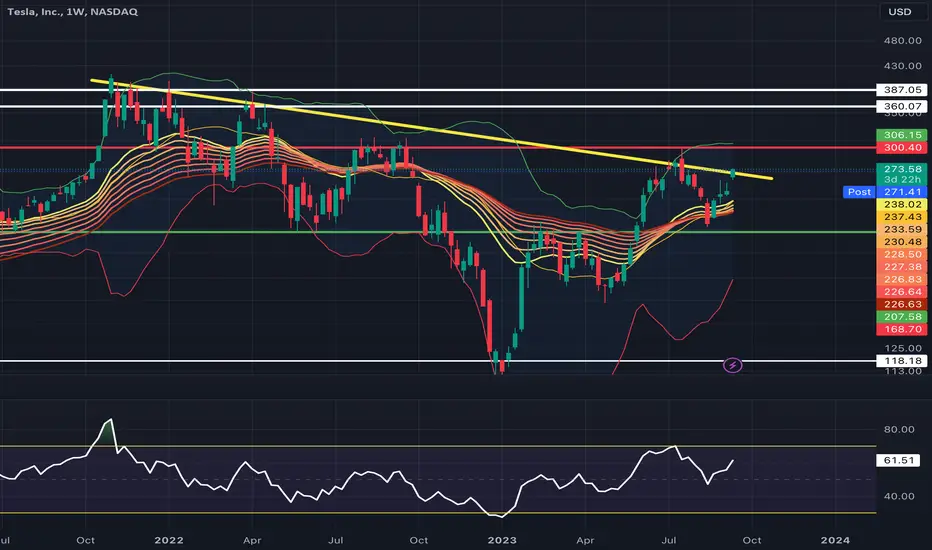
TSLA has reached the $270 price target (yellow resistance line). The next key price target is $300 where TSLA experienced strong selloff despite an excellent earnings report.
Key price levels to monitor:
(1) Red trendline - $300 resistance target
(2) White resistance zone between $360 and $387 near TSLA's all-time high
Technical Analysis Indicators:
- TSLA formed a bullish RSI bounce on the week of August 14 (40 RSI levels)
- This bounce occurred on the EMA ribbon and midrange of the Bollinger Band, which is also bullish
- The top of the Bollinger Band gives an estimated price target of $306.50 as a key resistance level, the Bollinger Bands will vary in price over time though.
Price Targets:
- $300-306 is my key short-term price target before considering the all-time high sell zone between $360-387.
Declinazione di responsabilità
Le informazioni ed i contenuti pubblicati non costituiscono in alcun modo una sollecitazione ad investire o ad operare nei mercati finanziari. Non sono inoltre fornite o supportate da TradingView. Maggiori dettagli nelle Condizioni d'uso.
Declinazione di responsabilità
Le informazioni ed i contenuti pubblicati non costituiscono in alcun modo una sollecitazione ad investire o ad operare nei mercati finanziari. Non sono inoltre fornite o supportate da TradingView. Maggiori dettagli nelle Condizioni d'uso.