Let’s reassess TSLA now that we have this new candle (a big move +4.73%) in context. This changes things substantially, so I’ll reapply candlestick techniques, assess trend health, box positioning, and momentum.
Candlestick Analysis
The new candle:
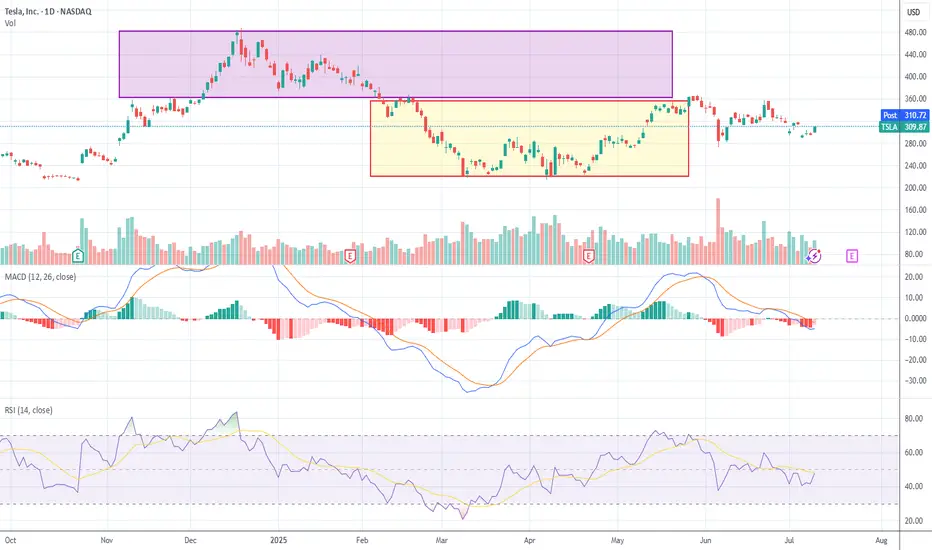
Large white body (+4.7%) closing at $309.87. Engulfing prior 2 candles’ real bodies → this is a Bullish Engulfing Pattern. Occurs near the 50% retracement ($290) zone (previous support). Volume expanded vs prior days → adds validity. Bullish engulfing after a down leg is an early reversal signal.
Context:
This happens after weeks of indecision candles (spinning tops / dojis) → classic “coiling” behavior before expansion.
Trend Health & Momentum
MACD: Still below zero but histogram bars turning less negative → momentum starting to shift.
RSI: Up to ~47.6, breaking out of its down channel. A move >50 would confirm momentum pivot.
Box Dynamics
TSLA just punched through the upper edge of Box 2 ($300) with conviction.
Now entering “no man’s land” between Box 2 ($300–$360) and Box 1 ($360–$465).
For a sustained breakout it must close above $306–310 range for 2-3 days. Ideally see follow-through with a test of $328 (78.6% Fib).
Tactical Breakdown
✅ Breakout case (higher probability now):
Bullish Engulfing + volume expansion at support zone.
Closing above $306-310 increases odds of a run toward $328 (78.6%) and possibly $360.
❌ Reversal back down (lower probability):
Only if TSLA immediately rejects $310 and falls back below $300 in the next 1–2 sessions.
This price action looks like accumulation showing its hand. Large white candle suggests buyers absorbing supply at prior resistance.
Breakout above $306 confirmed if follow-through continues. Odds for a reversal lower just dropped sharply after today’s engulfing.
Candlestick Analysis
The new candle:
Large white body (+4.7%) closing at $309.87. Engulfing prior 2 candles’ real bodies → this is a Bullish Engulfing Pattern. Occurs near the 50% retracement ($290) zone (previous support). Volume expanded vs prior days → adds validity. Bullish engulfing after a down leg is an early reversal signal.
Context:
This happens after weeks of indecision candles (spinning tops / dojis) → classic “coiling” behavior before expansion.
Trend Health & Momentum
MACD: Still below zero but histogram bars turning less negative → momentum starting to shift.
RSI: Up to ~47.6, breaking out of its down channel. A move >50 would confirm momentum pivot.
Box Dynamics
TSLA just punched through the upper edge of Box 2 ($300) with conviction.
Now entering “no man’s land” between Box 2 ($300–$360) and Box 1 ($360–$465).
For a sustained breakout it must close above $306–310 range for 2-3 days. Ideally see follow-through with a test of $328 (78.6% Fib).
Tactical Breakdown
✅ Breakout case (higher probability now):
Bullish Engulfing + volume expansion at support zone.
Closing above $306-310 increases odds of a run toward $328 (78.6%) and possibly $360.
❌ Reversal back down (lower probability):
Only if TSLA immediately rejects $310 and falls back below $300 in the next 1–2 sessions.
This price action looks like accumulation showing its hand. Large white candle suggests buyers absorbing supply at prior resistance.
Breakout above $306 confirmed if follow-through continues. Odds for a reversal lower just dropped sharply after today’s engulfing.
Declinazione di responsabilità
Le informazioni ed i contenuti pubblicati non costituiscono in alcun modo una sollecitazione ad investire o ad operare nei mercati finanziari. Non sono inoltre fornite o supportate da TradingView. Maggiori dettagli nelle Condizioni d'uso.
Declinazione di responsabilità
Le informazioni ed i contenuti pubblicati non costituiscono in alcun modo una sollecitazione ad investire o ad operare nei mercati finanziari. Non sono inoltre fornite o supportate da TradingView. Maggiori dettagli nelle Condizioni d'uso.