1. Chart Overview
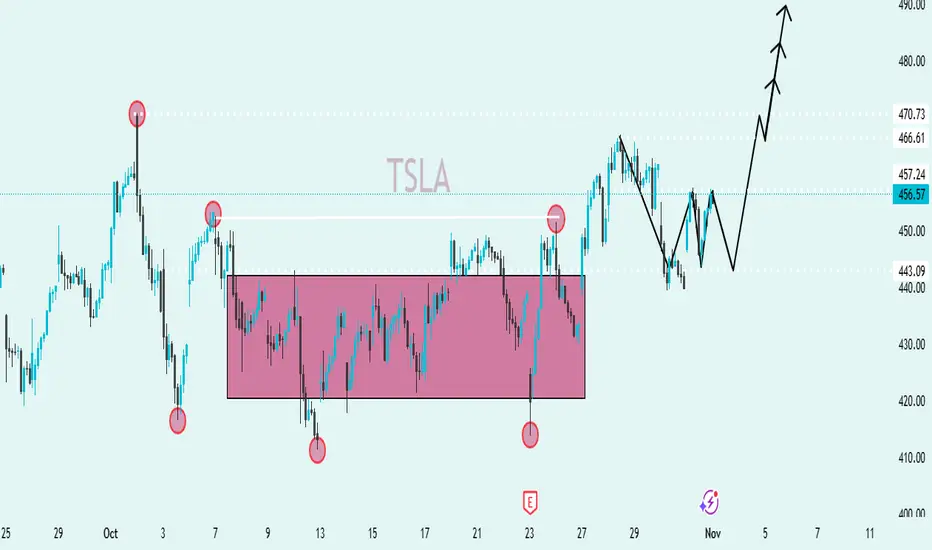
Ticker: TSLA (Tesla)
Timeframe: Short-term (likely 1-hour or 4-hour chart)
Current Price: Around $456.57
Date: November 1, 2025 (as shown on the chart)
---
🧩 2. Key Technical Structures
🔸 Range (Consolidation Zone)
The pink shaded box marks a sideways consolidation/range between roughly $430 and $450.
Price moved horizontally within this box for several sessions, indicating indecision or accumulation.
🔸 Breakout
Price has broken above the upper boundary of this range near $450, signaling a bullish breakout.
The breakout confirms that buyers gained control after a period of consolidation.
🔸 Support and Resistance Levels
Support: ~$443.09 — previous lower boundary of the range.
Resistance Levels:
$457.24 (current level, acting as pivot)
$466.61 (next resistance)
$470.73 (major target level)
---
📈 3. Pattern Recognition
The marked highs and lows (red circles) suggest a double bottom formation inside the range, which is a bullish reversal pattern.
The projection (black arrow) shows a retracement (minor dip) before a strong upward continuation toward $470+.
This path suggests a bullish wave structure (Elliott Wave–style impulse count or continuation move).
---
⚙️ 4. Technical Outlook
🔹 Bullish Scenario
If price holds above $450, TSLA is expected to move higher toward $466 → $471 → $480+.
The pattern implies momentum continuation after consolidation.
🔹 Bearish Risk
A drop below $443 would invalidate the bullish scenario and could lead back into the previous range (~$430).
---
📊 5. Summary
Aspect Observation
Trend Transitioning from range to bullish
Pattern Range breakout + potential bullish continuation
Key Support $443
Immediate Resistance $457
Targets $466, $471, $480
Bias Bullish (as long as $443 holds)
---
✅ Conclusion:
This chart suggests that TSLA has broken out of a consolidation phase and is now poised for a bullish continuation. Traders may look for buying opportunities above $450 with potential upside targets near $470–$480, while maintaining caution if price falls back below $443.
Trade attivo
JOIN MY TELEGRAM CHANNEL LINK 👇🏻
t.me/Classicallegendschool
t.me/Classicallegendschool
Declinazione di responsabilità
Le informazioni ed i contenuti pubblicati non costituiscono in alcun modo una sollecitazione ad investire o ad operare nei mercati finanziari. Non sono inoltre fornite o supportate da TradingView. Maggiori dettagli nelle Condizioni d'uso.