📉 Weekly Overview:
Price is currently held by a significant weekly resistance level. Last week formed bearish price action, indicating potential exhaustion from buyers and room for sellers to step in.
📉 Daily Chart:
Although no strong momentum candle yet, price has already broken internal bullish structure to the downside. EMA50 is starting to flatten, hinting at a potential momentum shift.
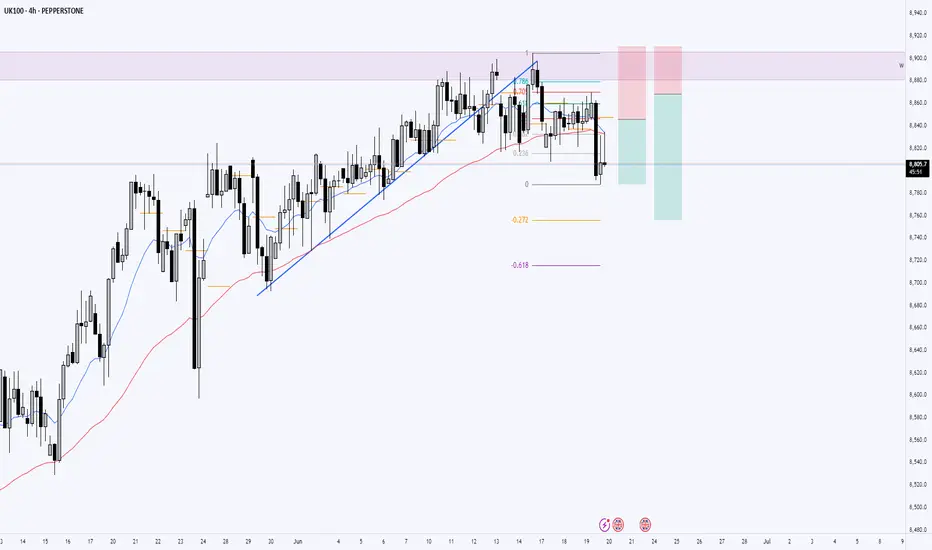
📉 4H Chart:
Clear sign of bearish transition – uptrend line is broken, price is now trading below the 50EMA, and we recently see strong seller momentum candles. This adds further confluence to bearish bias.
🔍 Plan:
Bias: Bearish
Entry: After bearish confirmation candle on 1H or 4H retracement to premium zone
Targets:
TP1: Previous 4H low
TP2: Daily support zone
Invalidation: Break and close above 4H 50EMA and recent structure high
Price is currently held by a significant weekly resistance level. Last week formed bearish price action, indicating potential exhaustion from buyers and room for sellers to step in.
📉 Daily Chart:
Although no strong momentum candle yet, price has already broken internal bullish structure to the downside. EMA50 is starting to flatten, hinting at a potential momentum shift.
📉 4H Chart:
Clear sign of bearish transition – uptrend line is broken, price is now trading below the 50EMA, and we recently see strong seller momentum candles. This adds further confluence to bearish bias.
🔍 Plan:
Bias: Bearish
Entry: After bearish confirmation candle on 1H or 4H retracement to premium zone
Targets:
TP1: Previous 4H low
TP2: Daily support zone
Invalidation: Break and close above 4H 50EMA and recent structure high
Trade chiuso: obiettivo raggiunto
TP hits on another account.Declinazione di responsabilità
Le informazioni ed i contenuti pubblicati non costituiscono in alcun modo una sollecitazione ad investire o ad operare nei mercati finanziari. Non sono inoltre fornite o supportate da TradingView. Maggiori dettagli nelle Condizioni d'uso.
Declinazione di responsabilità
Le informazioni ed i contenuti pubblicati non costituiscono in alcun modo una sollecitazione ad investire o ad operare nei mercati finanziari. Non sono inoltre fornite o supportate da TradingView. Maggiori dettagli nelle Condizioni d'uso.