🔎 1. Chart Pattern
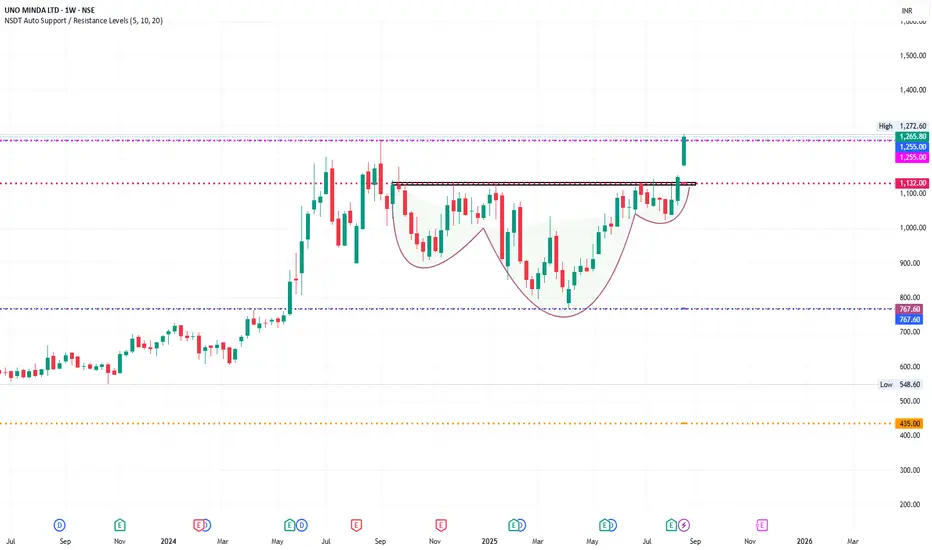
The chart is clearly showing a Cup and Handle Pattern (highlighted).
Breakout has happened above the neckline (~₹1130–1140) with strong bullish candle.
Cup & Handle is a continuation pattern – breakout targets can be measured.
📌 Target Calculation:
Depth of the cup = 1132 (neckline) – 767 (bottom) ≈ 365 points.
Breakout above 1132 → Target = 1132 + 365 = ₹1495 approx.
Short-term resistance: ₹1270–1280 (already touched).
Next zone: ₹1350 → ₹1450 → ₹1500.
🔎 2. Support & Resistance
Immediate Support: ₹1130–1150 (previous neckline).
Strong Support Zone: ₹1050–1070 (previous consolidation).
Major Support: ₹767 (cup bottom).
Immediate Resistance: ₹1270–1280 (tested).
Major Resistance Levels: ₹1350, then ₹1495.
🔎 3. Candlestick / Price Action
Current weekly candle is long green, wide-range, high volume breakout → very bullish.
Closing above ₹1250 is confirmation of breakout.
🔎 4. Indicators (if applied)
RSI (Relative Strength Index): Likely crossing above 65–70 → shows momentum but not yet extreme overbought (healthy breakout).
MACD: Likely bullish crossover with histogram expansion.
Volume: Breakout candle with strong volume confirms institutional buying.
Moving Averages:
Price is above 20W, 50W, 200W EMAs → strong uptrend.
Golden cross already confirmed earlier.
🔎 5. Trend Outlook
Primary Trend (1–2 years): Strong Bullish.
Intermediate Trend (2–6 months): Bullish continuation towards ₹1450–1500.
Short Term (1–4 weeks): May retest ₹1180–1200 before further rally.
📌 Conclusion (Expert View)
✅ Stock has given a Cup & Handle breakout above ₹1130 with strong momentum.
✅ Upside targets: ₹1350 → ₹1450 → ₹1500.
✅ Downside support: ₹1130, then ₹1050.
⚠️ Near-term, RSI may cool off → watch for pullback to ₹1180–1200 as entry opportunity.
👉 Strategy:
Swing Traders: Buy on dips near ₹1180–1200 with SL below ₹1050.
Investors: Can hold for long-term with next target ₹1500+.
This is only for educational pattern not for sugesstion.
Declinazione di responsabilità
Le informazioni ed i contenuti pubblicati non costituiscono in alcun modo una sollecitazione ad investire o ad operare nei mercati finanziari. Non sono inoltre fornite o supportate da TradingView. Maggiori dettagli nelle Condizioni d'uso.
Declinazione di responsabilità
Le informazioni ed i contenuti pubblicati non costituiscono in alcun modo una sollecitazione ad investire o ad operare nei mercati finanziari. Non sono inoltre fornite o supportate da TradingView. Maggiori dettagli nelle Condizioni d'uso.