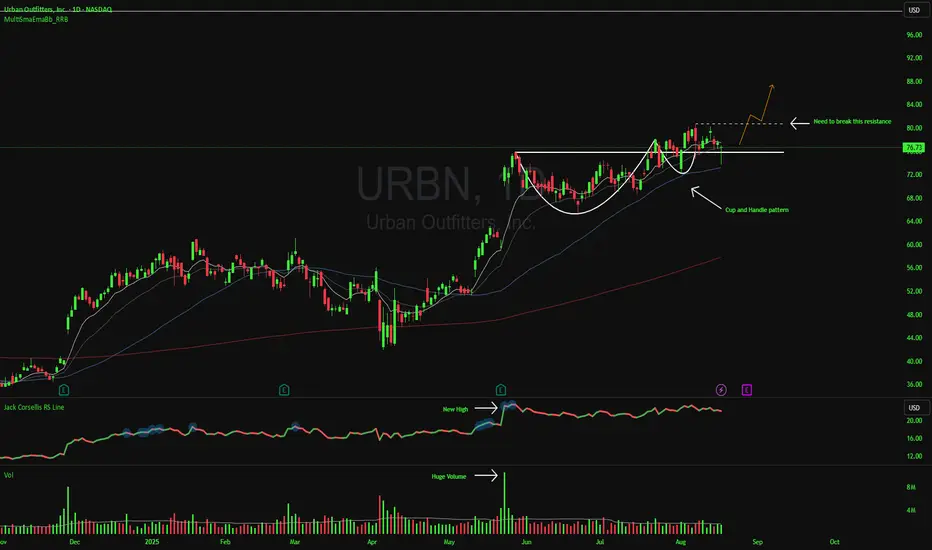
Furthermore, a Cup and Handle pattern has formed on the daily time frame. This classic bullish chart pattern has a high probability of success following a breakout. For confirmation, the price needs to break above the nearest high at $80.77.
Volume showed a significant surge on May 22, 2025.
Lastly, the company’s earnings per share (EPS) increased by 78.79%, reaching $1.18 compared to $0.66 in the same quarter of the prior year.
Declinazione di responsabilità
Le informazioni e le pubblicazioni non sono intese come, e non costituiscono, consulenza o raccomandazioni finanziarie, di investimento, di trading o di altro tipo fornite o approvate da TradingView. Per ulteriori informazioni, consultare i Termini di utilizzo.
Declinazione di responsabilità
Le informazioni e le pubblicazioni non sono intese come, e non costituiscono, consulenza o raccomandazioni finanziarie, di investimento, di trading o di altro tipo fornite o approvate da TradingView. Per ulteriori informazioni, consultare i Termini di utilizzo.
