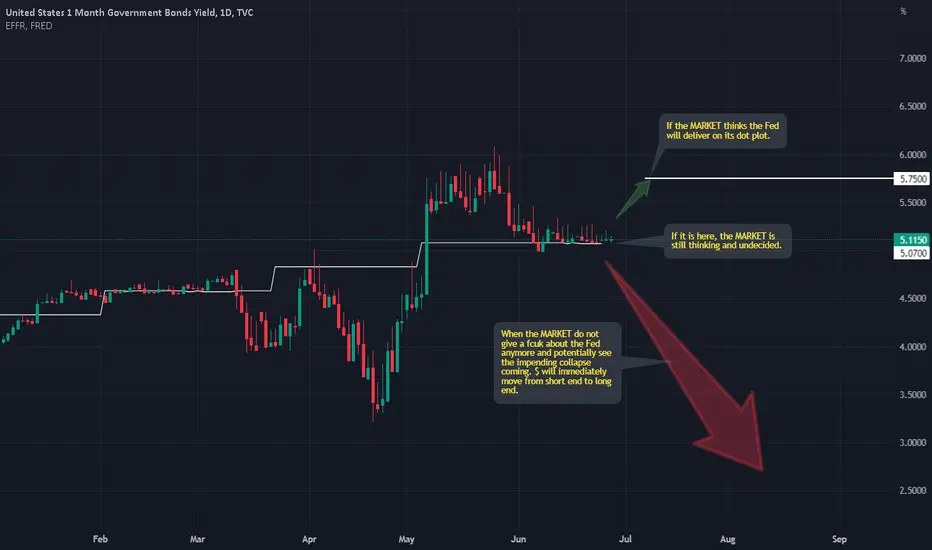
This chart is actually quite important. I take a look at it all the time.
It would be quite interesting when it starts to fall, ever so slightly at first, just below the EFFR.
We also need to understand which arrow is the BIGGER one. The green or the RED. This can easily answer which is the bigger POTENTIAL :)
Good luck.
P/S : DO not just believe what I say. Use your common sense.
If we look at the chart of most FX pairs, try not to look at the price action. Instead, look at the movement in volume. What I can see is that the MARKET is checking out if there are anymore BUYERs of risky assets. We can see it is running out of buyers, i.e. suckers. What lies ahead is easy to figure out.
Nota
<deleted>Nota
US03M just went BELOW the EFFR. Rate cut is coming!!!
Nota
Ooopppssss!!!!Finally.
$ will rise, it will rise until ............
Declinazione di responsabilità
Le informazioni e le pubblicazioni non sono intese come, e non costituiscono, consulenza o raccomandazioni finanziarie, di investimento, di trading o di altro tipo fornite o approvate da TradingView. Per ulteriori informazioni, consultare i Termini di utilizzo.
Declinazione di responsabilità
Le informazioni e le pubblicazioni non sono intese come, e non costituiscono, consulenza o raccomandazioni finanziarie, di investimento, di trading o di altro tipo fornite o approvate da TradingView. Per ulteriori informazioni, consultare i Termini di utilizzo.