Hey traders 👋
The US100 (NASDAQ 100) is currently sitting in a very interesting technical position on the 4-hour chart.
Let’s break it down 👇
🧭 Structure Overview
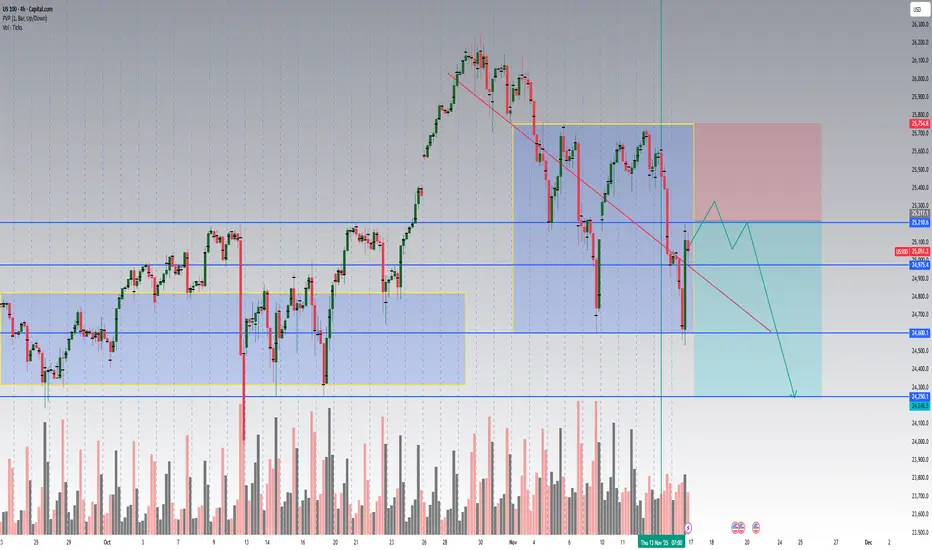
After a strong bullish leg that peaked near 25,800, the index entered a descending corrective channel.
We’ve now hit an important support cluster around 24,975 – 25,000, which previously acted as a pivot zone.
I’ve mapped two main liquidity boxes (blue & yellow) that show where buyers and sellers built positions during the last phases of consolidation.
Notice how price rejected from the upper boundary of the yellow box twice — confirming short-term supply pressure.
📊 Volume Analysis
Volume has been elevated on each red candle, confirming that this down-move isn’t just a retracement without conviction.
However, the most recent bar shows a strong bullish reaction on higher volume, indicating potential absorption — smart money may be defending the 25K handle.
If we see declining volume on the next two green candles → likely dead cat bounce.
If volume expands again above 25,200 → we might get a break and retest of the red trendline for a short-term continuation toward 25,600–25,750.
🧱 Key Levels
Zone Bias Comment
25 210 – 25 220 Resistance Prior liquidity flip zone, possible rejection area
24 975 – 25 000 Current support Reaction zone, watch for confirmation candle
24 600 Target 1 Measured-move projection
24 250 – 24 300 Target 2 Major daily demand zone / possible higher-low base
🔻 Bearish Scenario (Primary Plan)
Short bias remains valid below 25 210.
Expect a short-term bounce into 25 100–25 200, then rejection.
Targets: 24 600 → 24 250.
Invalidation: close above 25 220 on strong volume (would flip the structure bullish).
🟢 Bullish Alternative
If bulls can close a 4H candle above 25 210 – 25 220 with confirmed volume > previous red bar,
the down-channel breaks, and we may see a fast rally back to 25 600 – 25 750.
⚙️ Strategy Note
This chart is for educational & analytical purposes — not financial advice.
I’ll update if we get confirmation on the next 4-hour candle.
👉 Follow for updates and let me know your view — will the 25K zone hold or break next week?
📅 Summary
Trend: Medium-term uptrend, short-term correction
Bias: Bearish below 25 210
Setup: Channel rejection → continuation toward 24 600 / 24 250
Risk: Volume-based breakout above 25 220
Hit 👍 and follow if you found this breakdown helpful — I post detailed NAS100 / SPX / DAX updates every week with volume-based setups.
Let’s grow the community together 🚀
Would you like me to format it with hashtags and keyword tags (so it ranks better in TradingView search, like #US100 #NASDAQ #TechnicalAnalysis #PriceAction #VolumeProfile)? I can add that next.
The US100 (NASDAQ 100) is currently sitting in a very interesting technical position on the 4-hour chart.
Let’s break it down 👇
🧭 Structure Overview
After a strong bullish leg that peaked near 25,800, the index entered a descending corrective channel.
We’ve now hit an important support cluster around 24,975 – 25,000, which previously acted as a pivot zone.
I’ve mapped two main liquidity boxes (blue & yellow) that show where buyers and sellers built positions during the last phases of consolidation.
Notice how price rejected from the upper boundary of the yellow box twice — confirming short-term supply pressure.
📊 Volume Analysis
Volume has been elevated on each red candle, confirming that this down-move isn’t just a retracement without conviction.
However, the most recent bar shows a strong bullish reaction on higher volume, indicating potential absorption — smart money may be defending the 25K handle.
If we see declining volume on the next two green candles → likely dead cat bounce.
If volume expands again above 25,200 → we might get a break and retest of the red trendline for a short-term continuation toward 25,600–25,750.
🧱 Key Levels
Zone Bias Comment
25 210 – 25 220 Resistance Prior liquidity flip zone, possible rejection area
24 975 – 25 000 Current support Reaction zone, watch for confirmation candle
24 600 Target 1 Measured-move projection
24 250 – 24 300 Target 2 Major daily demand zone / possible higher-low base
🔻 Bearish Scenario (Primary Plan)
Short bias remains valid below 25 210.
Expect a short-term bounce into 25 100–25 200, then rejection.
Targets: 24 600 → 24 250.
Invalidation: close above 25 220 on strong volume (would flip the structure bullish).
🟢 Bullish Alternative
If bulls can close a 4H candle above 25 210 – 25 220 with confirmed volume > previous red bar,
the down-channel breaks, and we may see a fast rally back to 25 600 – 25 750.
⚙️ Strategy Note
This chart is for educational & analytical purposes — not financial advice.
I’ll update if we get confirmation on the next 4-hour candle.
👉 Follow for updates and let me know your view — will the 25K zone hold or break next week?
📅 Summary
Trend: Medium-term uptrend, short-term correction
Bias: Bearish below 25 210
Setup: Channel rejection → continuation toward 24 600 / 24 250
Risk: Volume-based breakout above 25 220
Hit 👍 and follow if you found this breakdown helpful — I post detailed NAS100 / SPX / DAX updates every week with volume-based setups.
Let’s grow the community together 🚀
Would you like me to format it with hashtags and keyword tags (so it ranks better in TradingView search, like #US100 #NASDAQ #TechnicalAnalysis #PriceAction #VolumeProfile)? I can add that next.
Trade attivo
Nota
1. TP doneNota
2. TP doneTrade chiuso: obiettivo raggiunto
Sharing clean, logical market analysis focused on liquidity, structure and volume. No signals, no pressure — just education. If you want more insights, you’re welcome to join: t.me/CE3vdc5m72w4MjRk
Declinazione di responsabilità
Le informazioni e le pubblicazioni non sono intese come, e non costituiscono, consulenza o raccomandazioni finanziarie, di investimento, di trading o di altro tipo fornite o approvate da TradingView. Per ulteriori informazioni, consultare i Termini di utilizzo.