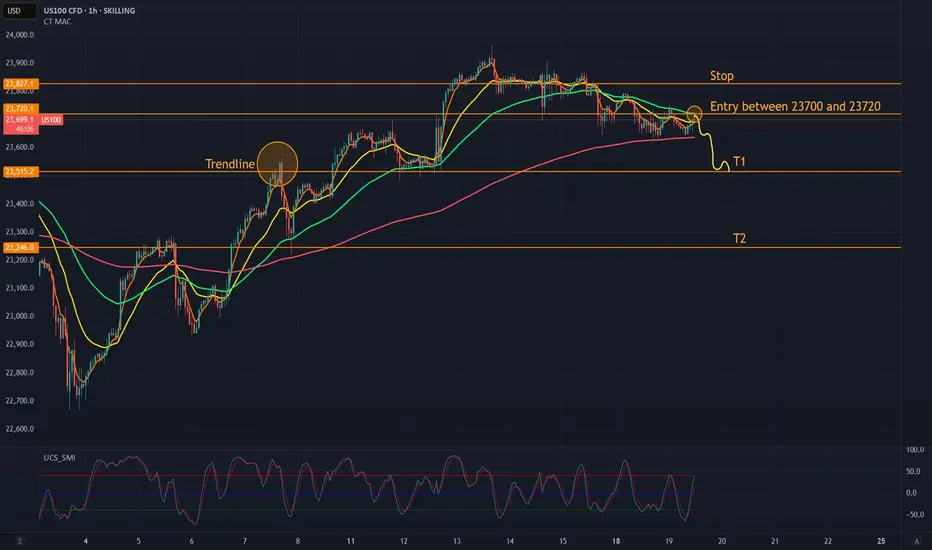
The Nasdaq 100 (US100) is currently trading around 23,700 and has shown clear signs of weakness in the past few hours.
On the 1-hour chart, the price has tested the area between 23,700 and 23,720 multiple times but failed to break through. Moving averages (yellow, green, and red lines) are flat or turning downward, which signals that bullish momentum is fading.
Trade Setup
Entry Zone: 23,700 – 23,720
This area has acted as resistance several times, meaning the price keeps bouncing off it without breaking higher.
Stop Loss: Above 23,827
This is the most recent clear high on the chart. If price breaks above this level, the setup is invalid.
Target 1 (T1): 23,515
This level acted as support on August 13 and 15. Price bounced here twice, making it a realistic first target.
Target 2 (T2): 23,246
This level was support on August 8 and 9 and could be reached if T1 breaks.
Why Short?
Price is below the 21 EMA on 4h timeframe (yellow line): This is a sign of weakening trend strength.
Price rejected multiple times at the moving averages: Buyers failed to push higher.
No new highs: Even after several attempts, price could not break above 23,827.
What supports the short idea right now
Tech under pressure: Meta and Palantir are both trading lower after weak follow-ups on AI and earnings momentum. This drags on overall sector sentiment.
No new highs: The market failed again to break above the last swing high at 23,827, which strengthens the case for continued consolidation or downside.
Dollar strength creeping in: Ongoing geopolitical tension (Ukraine, Trump talks) is pushing the USD up slightly – this tends to weigh on tech stocks.
Jackson Hole caution: Markets are waiting for Powell’s comments later this week. Until then, many traders stay risk-off, which favors downside movement or at least weak buying.
Summary
📉 Short entry: 23,700 – 23,720
⛔ Stop: Above 23,827
🎯 T1: 23,515
🎯 T2: 23,246
No financial advice – just my personal trade idea based on what the chart shows and the current macro situation.
And don’t forget: the market has two moods – “not yet” and “too late.” :D
Trade attivo
Alright, opened position at 23718. Short.Nota
Target 1 - Reached :)Trade chiuso: obiettivo raggiunto
Target 2 reached - Trade closed at 23510Declinazione di responsabilità
Le informazioni e le pubblicazioni non sono intese come, e non costituiscono, consulenza o raccomandazioni finanziarie, di investimento, di trading o di altro tipo fornite o approvate da TradingView. Per ulteriori informazioni, consultare i Termini di utilizzo.
Declinazione di responsabilità
Le informazioni e le pubblicazioni non sono intese come, e non costituiscono, consulenza o raccomandazioni finanziarie, di investimento, di trading o di altro tipo fornite o approvate da TradingView. Per ulteriori informazioni, consultare i Termini di utilizzo.