Market Structure Alignment
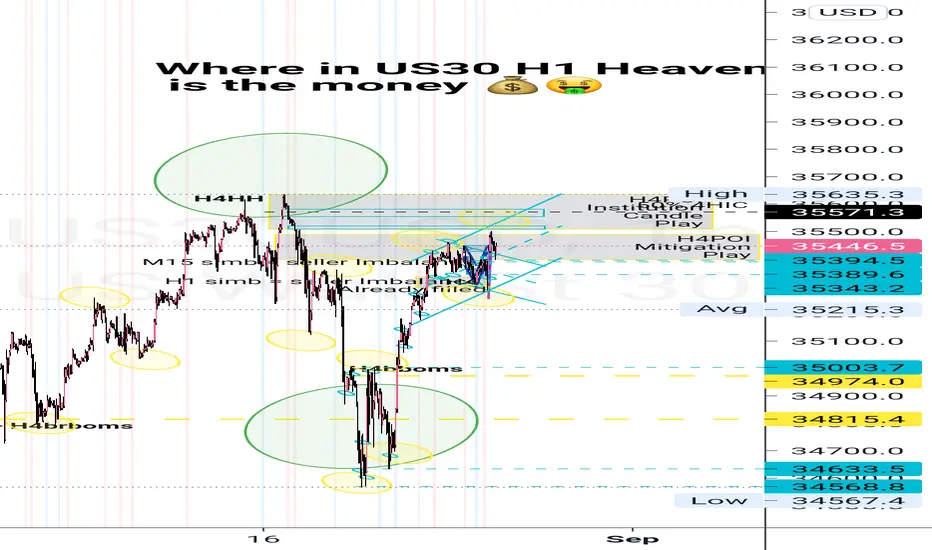
US30
M = b
W = b
D = b
H4 = b
H1 = b
M15 = b
M5 = b
M1 = b
*********************************************
BIASES:
BB = Bullish BIAS
BRB = Bearish BIAS
****************************************
CODES:
b = Bullish
bg = Bullish Range
br = Bearish
brg = Bearish Range
****************************************
Bimb = Buyers IMBalance
Simb = Sellers IMBalance
****************************************
Boms = Break of Market Structure
Bboms = Bullish Break of Market Structure
Brboms = Bearish Break of Market Structure
****************************************
DZ = DemandZONE
SZ =SupplyZONE
****************************************
H = High
HH = HigherHIGH
HL = HigherLOW
*********************************************
L = Lower
LL = LowerLOW
LH = LowerHIGH
*********************************************
Black = Monthly
Red = Weekly
Green = Daily
Yellow = H4
SkyBlue = H1
NavyBlue = M15
Pink = M5
Purple = M1
Orange = Alerts
****************************************
Let your SUCCEESS be your REVENGE... Learn2EARN,
As long as the OUTCOME is INCOME, we are good!
T.I.M.E. - Things I must Experience
F.E.A.R. - Face Everything And Rise
S.Y.S.T.E.M. - Save Yourself Serious Time Earning Money
Be Coachable...It's NEVER too
As long as the OUTCOME is INCOME, we are good!
T.I.M.E. - Things I must Experience
F.E.A.R. - Face Everything And Rise
S.Y.S.T.E.M. - Save Yourself Serious Time Earning Money
Be Coachable...It's NEVER too
Declinazione di responsabilità
Le informazioni ed i contenuti pubblicati non costituiscono in alcun modo una sollecitazione ad investire o ad operare nei mercati finanziari. Non sono inoltre fornite o supportate da TradingView. Maggiori dettagli nelle Condizioni d'uso.