Technical Analysis: US Indices Continuation Patterns 📈
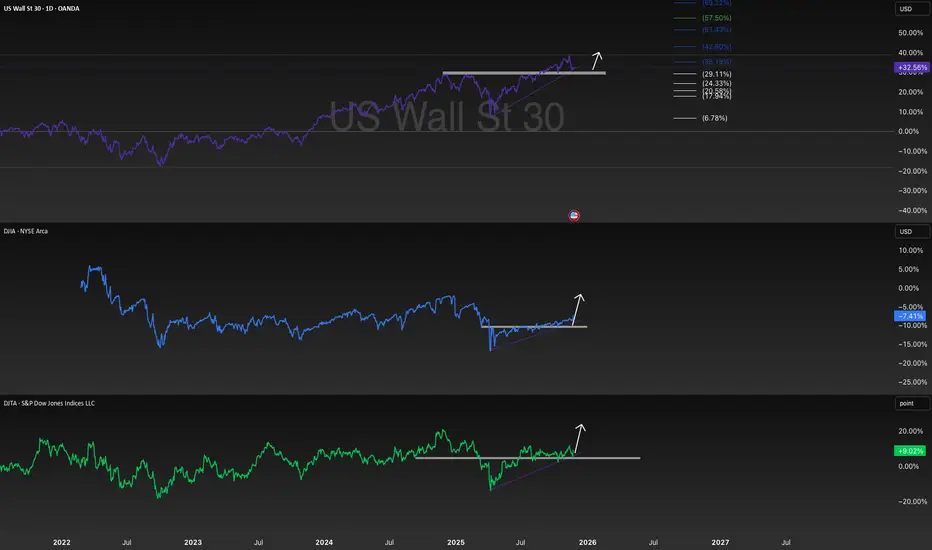
Based on the provided chart, which displays the US Wall St 30 (Dow Jones Industrial Average CFD), the DJI (Dow Jones Industrial Average), and the DJTA (Dow Jones Transportation Average), a clear technical pattern suggests a continuation of the bullish trend across all three indices.
1. Pattern Identification: Ascending Triangles
The dominant chart pattern observed across the US Wall St 30, the DJI, and the DJTA is the Ascending Triangle formation.
Structure: This is a bullish continuation pattern characterized by a relatively flat horizontal resistance line (the highs) and a rising lower trendline (the lows).
Interpretation: The horizontal resistance indicates a level where selling pressure is persistent. The rising lower trendline, connecting progressively higher lows, demonstrates that buyers are becoming more aggressive over time, consistently stepping in to buy at higher prices. This indicates a buildup of buying pressure (accumulation) beneath the resistance level.
Resolution: The pattern is confirmed upon a decisive breakout above the horizontal resistance line, signaling that the buyers have finally overwhelmed the sellers and the prior uptrend is set to continue. The chart illustrates a potential breakout phase for all three indices, indicated by the upward arrows extending from the apex of the triangles.
2. Validation of Dow Theory Conditions
The relationship between the Dow Jones Industrial Average (DJI) and the Dow Jones Transportation Average (DJTA) is a key component of Dow Theory. The theory posits that for a major trend to be confirmed, both the Industrial and Transportation averages must move in the same direction.
Condition: An advance in the Industrial Average must be accompanied by a corresponding advance in the Transportation Average.
Chart Evidence:
DJI (Dow Jones Industrial Average): Shows the formation of a clear ascending triangle pattern, indicating an expected move to the upside (continuation of the uptrend).
DJTA (Dow Jones Transportation Average): Displays a very similar and concurrent ascending triangle pattern, also forecasting a move to the upside.
Conclusion: Since both the DJI and DJTA are exhibiting simultaneous, strong bullish continuation patterns (Ascending Triangles) and are currently posturing for a coordinated upward breakout, the charts provide a powerful confirmation of the primary bullish trend as per the requirements of Dow Theory. The technical setup across the major averages is congruent, strengthening the bullish thesis for the broader US market.
3. Price Targets and Confluence
The traditional method for setting a price target following an ascending triangle breakout is to measure the height of the back of the triangle (the widest part) and project that distance vertically from the point of the breakout.
US Wall St 30 (Top Panel):
The recent consolidation phase (Ascending Triangle) is preceded by a strong multi-year uptrend.
Fibonacci extension levels are marked above the resistance, which act as potential price targets following a breakout: 15.72% and 19.34% are visible targets, indicating a significant expected price movement upon confirmation.
The consolidation is occurring near recent all-time highs, suggesting a period of accumulation before the next leg higher.
Summary and Outlook
The technical analysis strongly supports a bullish continuation outlook for the indices. The presence of the Ascending Triangle continuation pattern on all three major US averages, coupled with the alignment of the DJI and DJTA, provides robust confirmation of the overall primary uptrend as per Dow Theory. A definitive breakout above the horizontal resistance lines would trigger the next major move higher, with price targets set by the measured move of the pattern and confirmed by the visible Fibonacci extension levels.
Disclaimer: This analysis is based solely on the provided chart and established technical analysis principles. It is for informational and educational purposes only and does not constitute investment advice. Trading involves substantial risk, and professional advice should be sought before making any investment decisions.
Declinazione di responsabilità
Le informazioni e le pubblicazioni non sono intese come, e non costituiscono, consulenza o raccomandazioni finanziarie, di investimento, di trading o di altro tipo fornite o approvate da TradingView. Per ulteriori informazioni, consultare i Termini di utilizzo.
Declinazione di responsabilità
Le informazioni e le pubblicazioni non sono intese come, e non costituiscono, consulenza o raccomandazioni finanziarie, di investimento, di trading o di altro tipo fornite o approvate da TradingView. Per ulteriori informazioni, consultare i Termini di utilizzo.