WHY
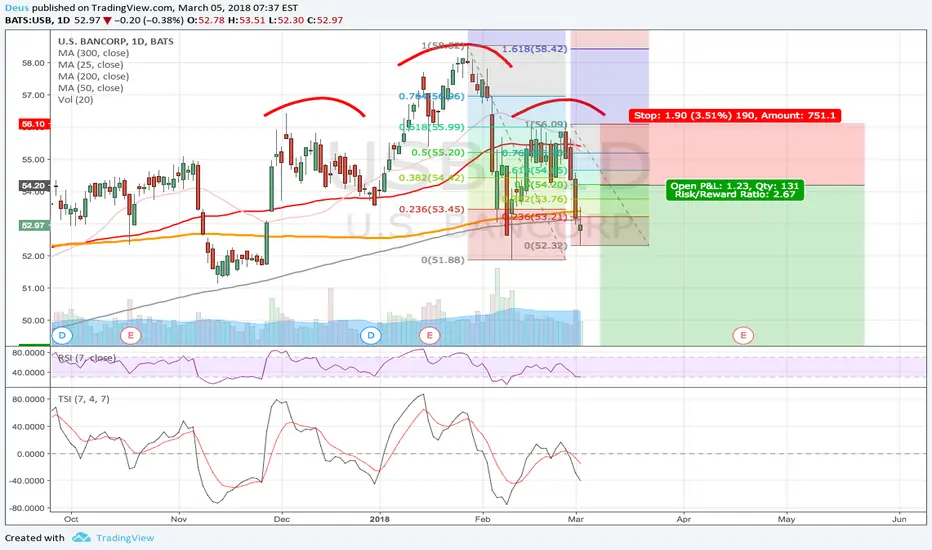
1. USB traced well pronounced head and shoulders pattern on D and W.
2. Other industry (finance) stocks such as GS, WFS also posted a reversal on W and M.
3. SPX500 seems to be looking south on W
TRADE DURATION and PROFIT TARGET
USB and market in general might be starting long bearish trend however here we target the distance to
- approximately equal to the height of the H&S structure
- 200MA on W basis (highest timeframe where pattern is visible)
- support determined by previous highs
HOW
1. Short stocks with risk reward 4.0
2. Avoid options as it can be a long story
ENTRY
Trade will be entered 4H (lower timeframe) with SL
Waiting for at least 0.5 Fibo retracement for better RtW ratio
Trade attivo
I guess these divergences mean lower lows ahead
➡️t.me/charta_energeia — regular Elliott Wave and trend analysis on Oil, Gas, and Crypto.
Declinazione di responsabilità
Le informazioni e le pubblicazioni non sono intese come, e non costituiscono, consulenza o raccomandazioni finanziarie, di investimento, di trading o di altro tipo fornite o approvate da TradingView. Per ulteriori informazioni, consultare i Termini di utilizzo.