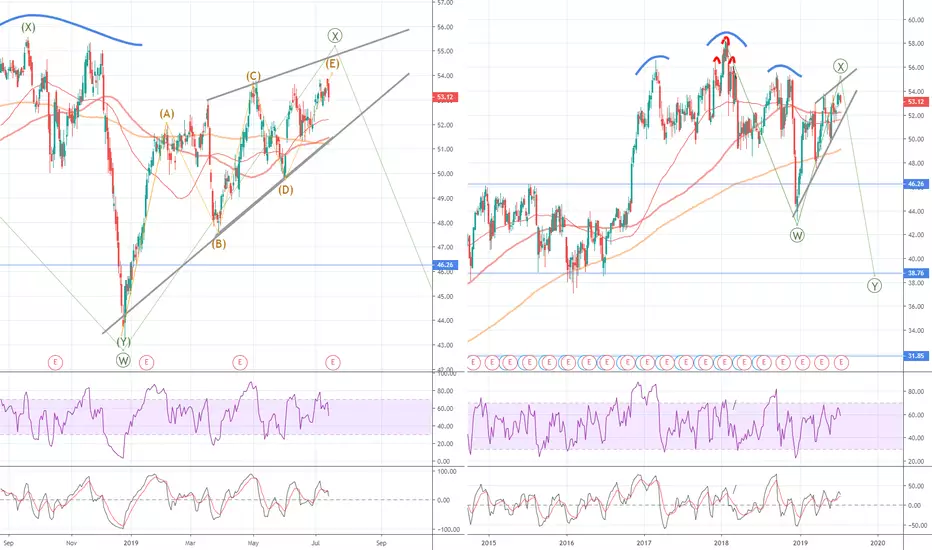
Yet another H&S structure (with smaller fractal in red noticed a while ago). Now the structure is confirmed by a rising wedge which may be already complete or in its final stages. Tomorrow USB will report earnings. This could make the price swing and complete the wedge or break down from here. Either way, I will be buying puts today. This chart made me reconsider BBT trade where I saw an alternative interpretation in line with my bearish stance on USB and the market in general.
Trade attivo
Yesterday's jump on earning completed the correction. I have bought some put options and today I will be selling my BBT holdings. Trade attivo
Closed my puts with a small profit to wait until the price corrects as described Will buy October puts on this correction (if the broader market also confirms the end of the bounce)
➡️t.me/charta_energeia — regular Elliott Wave and trend analysis on Oil, Gas, and Crypto.
Pubblicazioni correlate
Declinazione di responsabilità
Le informazioni e le pubblicazioni non sono intese come, e non costituiscono, consulenza o raccomandazioni finanziarie, di investimento, di trading o di altro tipo fornite o approvate da TradingView. Per ulteriori informazioni, consultare i Termini di utilizzo.