USDT Dominance - Weekly Chart Overview
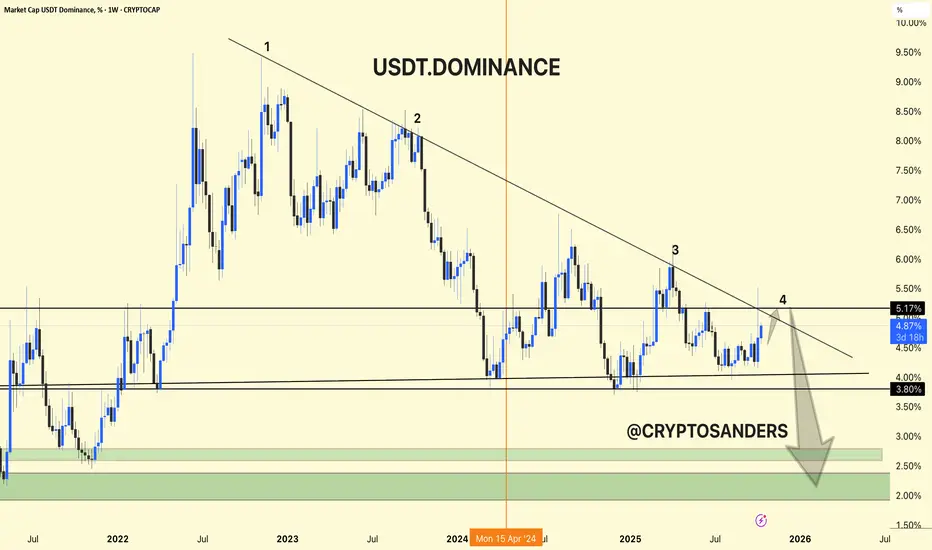
Current Level: 4.88%
Trend Structure: The chart clearly forms an aspect ratio pattern, consisting of a series of lower highs and lower lows since mid-2022.
Ascending Telgero/Declining Channel - Continuous pressure is being displayed from the ascending Telgero.
1. Key Resistance Area (5.0%–5.2%)
USDT Dominant is currently undergoing a restart test of the ascending critical line, which has acted as strong resistance several times in the past.
Every time the price retests this trend line, it corrects – indicating a shift of funds from stablecoins to crypto assets.
If the price does not close above 5.2%, it could trigger the next bearish move to the downside.
2. Support Levels
First Support: Around 3.8% – a key chocolate demand area.
Key support zone: Between 2.0%-2.5% (green zone applied).
This level is typical of the Initial Petroleum Model and historically marks major crypto bull runs.
3. Uptrend Outlook
The large downward arrow on the chart indicates a continuation of the slope.
If dominance is below 3.8%, it could move towards the 2-2.5% zone, which indicates that traders are shifting investments from USDT to BTC and altcoins – a bullish trend for the crypto market.
This means that traders are selling crypto and holding stablecoins → risk-off, fear in the market.
When USDT dominance falls:
It means that money is flowing from stablecoins to BTC and altcoins → risk-off sentiment, confidence is returning.
DYOR | NFA
Pubblicazioni correlate
Declinazione di responsabilità
Le informazioni e le pubblicazioni non sono intese come, e non costituiscono, consulenza o raccomandazioni finanziarie, di investimento, di trading o di altro tipo fornite o approvate da TradingView. Per ulteriori informazioni, consultare i Termini di utilizzo.