Today, I’m going to analyze Market Cap USDT Dominance%( USDT.D) on the weekly timeframe for you. The reason I want to analyze USDT.D% is that the crypto market conditions have become a bit complex lately, and many factors are influencing it. Therefore, it’s better to take a look at the weekly chart of USDT.D%.
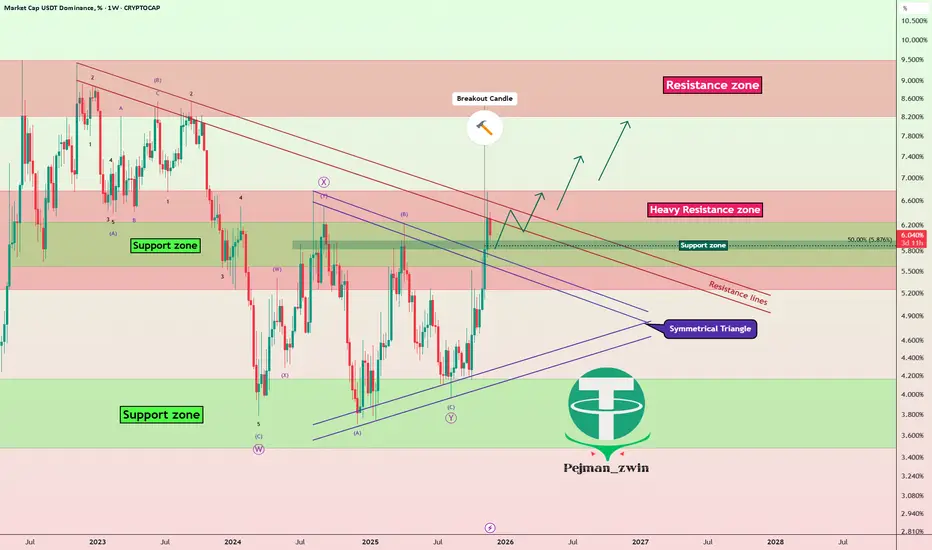
Currently, it seems that USDT.D% is in the vicinity of a Heavy Resistance zone(6.78%-5.25%), but at the same time, there’s also a Support zone(6.24%-5.57%) that could potentially lead to an increase in USDT.D%.
From a classical technical analysis perspective, we can clearly see on the weekly chart that the upper lines of the symmetrical triangle have been broken, and it seems that USDT.D% is currently pulling back to those upper lines. As long as it doesn’t move below those lines again, we can still expect that the market correction is ongoing and hasn’t ended yet. This is a sign that helps us gauge whether the crypto market correction is complete or still ongoing.
From an Elliott Wave perspective, with the breakout of the symmetrical triangle, it seems that USDT.D% might be starting a new impulsive wave.
Since we’re not seeing Regular Divergence(RD-) at the highs, it indicates that the recent upward movement in the crypto market, especially Bitcoin’s( BTCUSDT) recent gains, is still part of the correction phase.
In conclusion, based on the above analysis, I expect USDT.D% to rise again. If USDT.D% breaks through the resistance lines, we can hope that it will also break through the Heavy Resistance zone(6.78%-5.25%), and that would be a negative sign for the crypto market, potentially leading to deeper corrections in the coming weeks.
So, what do you think? Do you believe the crypto market correction is over, or do you think it will continue? That’s a nice question to leave our analysis with.
Stop Loss(SL): 5.49%
💡 Please respect each other's opinions and express agreement or disagreement politely.
📌Market Cap USDT Dominance% Analyze (USDT.D%), Weekly time frame.
🛑 Always set a Stop Loss(SL) for every position you open.
✅ This is just my idea; I’d love to see your thoughts too!
🔥 If you find it helpful, please BOOST this post and share it with your friends.
Currently, it seems that USDT.D% is in the vicinity of a Heavy Resistance zone(6.78%-5.25%), but at the same time, there’s also a Support zone(6.24%-5.57%) that could potentially lead to an increase in USDT.D%.
From a classical technical analysis perspective, we can clearly see on the weekly chart that the upper lines of the symmetrical triangle have been broken, and it seems that USDT.D% is currently pulling back to those upper lines. As long as it doesn’t move below those lines again, we can still expect that the market correction is ongoing and hasn’t ended yet. This is a sign that helps us gauge whether the crypto market correction is complete or still ongoing.
From an Elliott Wave perspective, with the breakout of the symmetrical triangle, it seems that USDT.D% might be starting a new impulsive wave.
Since we’re not seeing Regular Divergence(RD-) at the highs, it indicates that the recent upward movement in the crypto market, especially Bitcoin’s(
In conclusion, based on the above analysis, I expect USDT.D% to rise again. If USDT.D% breaks through the resistance lines, we can hope that it will also break through the Heavy Resistance zone(6.78%-5.25%), and that would be a negative sign for the crypto market, potentially leading to deeper corrections in the coming weeks.
So, what do you think? Do you believe the crypto market correction is over, or do you think it will continue? That’s a nice question to leave our analysis with.
Stop Loss(SL): 5.49%
💡 Please respect each other's opinions and express agreement or disagreement politely.
📌Market Cap USDT Dominance% Analyze (USDT.D%), Weekly time frame.
🛑 Always set a Stop Loss(SL) for every position you open.
✅ This is just my idea; I’d love to see your thoughts too!
🔥 If you find it helpful, please BOOST this post and share it with your friends.
🎁Get a 20% Discount on your trading FEE on BYBIT:👉partner.bybit.com/b/PEJMANZWIN
Declinazione di responsabilità
Le informazioni e le pubblicazioni non sono intese come, e non costituiscono, consulenza o raccomandazioni finanziarie, di investimento, di trading o di altro tipo fornite o approvate da TradingView. Per ulteriori informazioni, consultare i Termini di utilizzo.