On the daily timeframe, USOIL is in a clear downtrend.
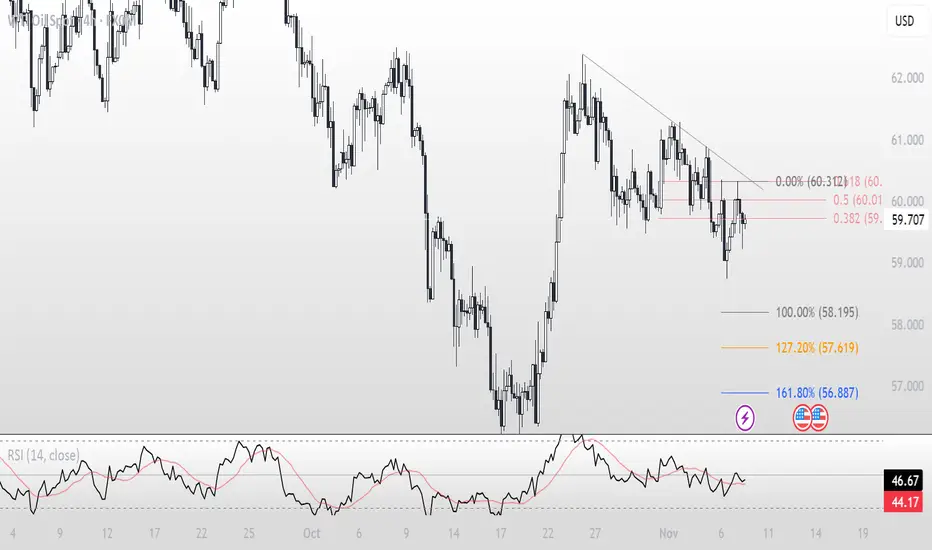
On the 4H timeframe, a bearish pattern has formed after breaking the previous low, followed by a corrective move up to the Fibonacci golden zone.
Bearish candles appeared in that area, indicating a possible continuation of the downtrend toward the downside targets.
Targets are shown on the chart — based on Fibonacci extension levels and a double top pattern.
Do you agree with this bearish setup?
Declinazione di responsabilità
Le informazioni ed i contenuti pubblicati non costituiscono in alcun modo una sollecitazione ad investire o ad operare nei mercati finanziari. Non sono inoltre fornite o supportate da TradingView. Maggiori dettagli nelle Condizioni d'uso.
Declinazione di responsabilità
Le informazioni ed i contenuti pubblicati non costituiscono in alcun modo una sollecitazione ad investire o ad operare nei mercati finanziari. Non sono inoltre fornite o supportate da TradingView. Maggiori dettagli nelle Condizioni d'uso.