Long
Double Bottom Chart Pattern
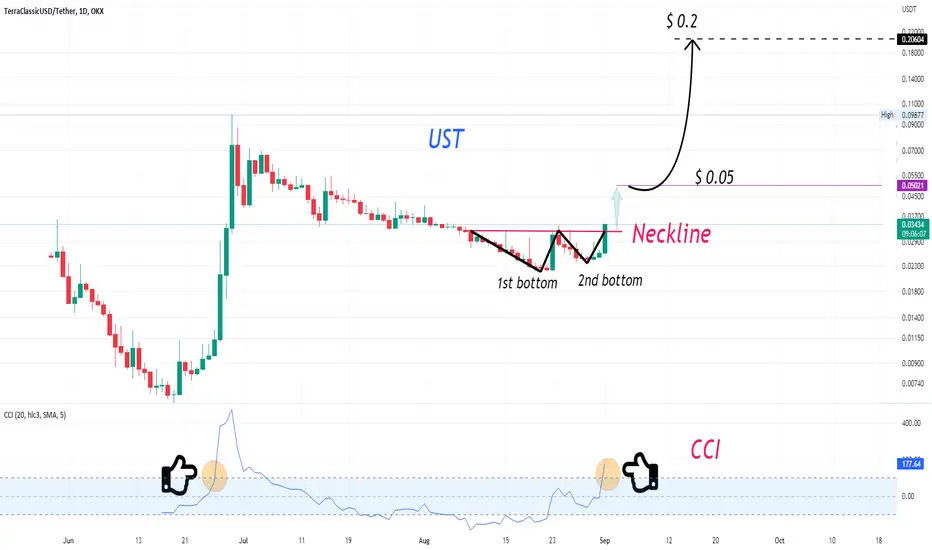
The chart above displays a double bottom pattern after a strong downtrend.
This means that there is a wide window of opportunity
Target- 1 = $ 0.05
Target -2 = $ 0.2
Target- 3= $ 0.282 (+850%)
Nota
Nota
Nota
Nota
UST +51%Nota
(Yesterday), people thought I was wrong :)Nota
Nota
Nota
Nota
Nota
Elliott Wave(s)Nota
Nota
Nota
Nota
Nota
Nota
Nota
Nota
Pubblicazioni correlate
Declinazione di responsabilità
Le informazioni ed i contenuti pubblicati non costituiscono in alcun modo una sollecitazione ad investire o ad operare nei mercati finanziari. Non sono inoltre fornite o supportate da TradingView. Maggiori dettagli nelle Condizioni d'uso.
Pubblicazioni correlate
Declinazione di responsabilità
Le informazioni ed i contenuti pubblicati non costituiscono in alcun modo una sollecitazione ad investire o ad operare nei mercati finanziari. Non sono inoltre fornite o supportate da TradingView. Maggiori dettagli nelle Condizioni d'uso.