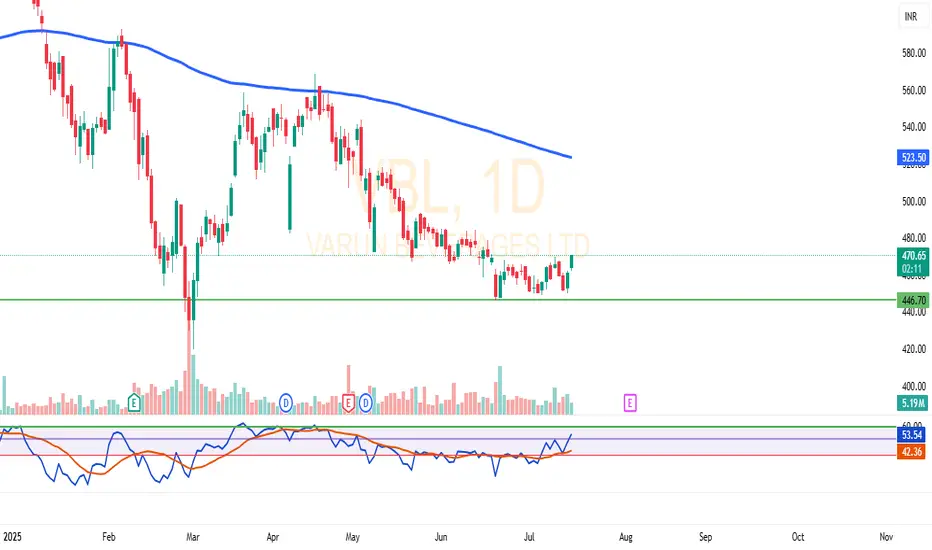
VBL has shown multiple rebounds from the strong support zone around ₹446.
After several weeks of sideways consolidation, the stock is attempting a breakout with increased volume in the current session.
The RSI indicator has moved above the 50 level with a bullish crossover, indicating potential strength building up.
On the upside, the 200 EMA near ₹523 may act as a resistance level.
📊 This is a technical observation based on price structure, volume, and momentum — not a buy/sell recommendation.
The setup appears interesting for technical traders watching for a breakout from this range.
🔍 What’s your take on this pattern? Feel free to share your view in the comments.
Declinazione di responsabilità
Le informazioni ed i contenuti pubblicati non costituiscono in alcun modo una sollecitazione ad investire o ad operare nei mercati finanziari. Non sono inoltre fornite o supportate da TradingView. Maggiori dettagli nelle Condizioni d'uso.
Declinazione di responsabilità
Le informazioni ed i contenuti pubblicati non costituiscono in alcun modo una sollecitazione ad investire o ad operare nei mercati finanziari. Non sono inoltre fornite o supportate da TradingView. Maggiori dettagli nelle Condizioni d'uso.