Long
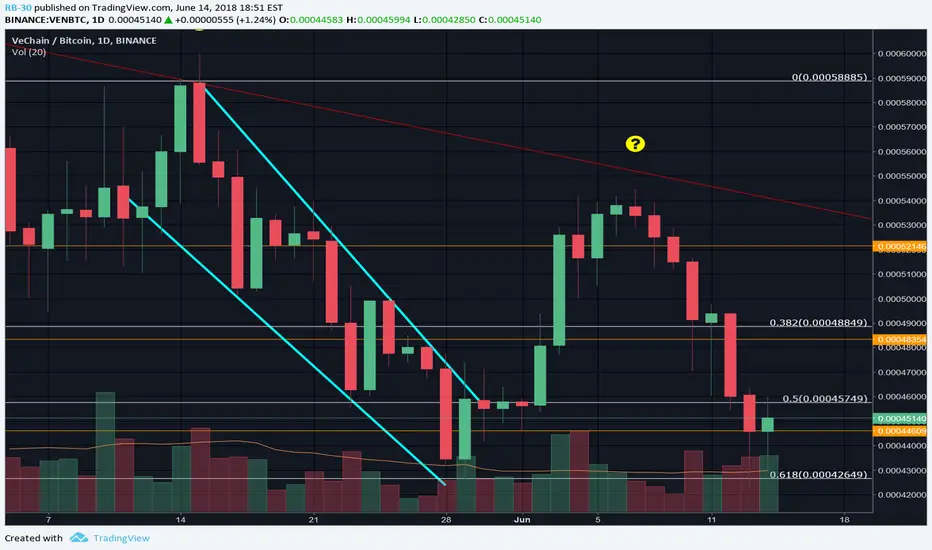
15 June -> Long on Vechain (Day Chart)

If you look at every daily chart, you will see that almost every coin has a bullish pattern sign. This doesn’t really imply that the downtrend is over or that there will be an uptrend. We only know that the bulls are declining the downward trend.
The first thing I want to talk about is the Head & Shoulders, after the uptrend you see that the chart is forming a Head & Shoulders, this does NOT mean that the pattern is completed. But keep it in your mind for later, when you see any signs of instability.
Second thing I want to talk about is that there is a probability that Vechain goes up. First of all you see that the second last candlestick ended up in a bullish pattern, the hammers, and after this hammer you see a confirmation. Also these hammers are holding the support line of 0.00044609 and the Fibonacci line of 0.618 (0.00042649). Besides we see after the uptrend a continuation pattern, the bullish flag. I think this will give us a little bit more probability that it will go up. Why do I say “a little bit more”? Well it is very hard to break that pattern, so it doesn’t really tells us that the trend is going to continue.
At I want to talk about the setup for this trade. The stop loss will be the support line of 0.0044609, but you can also choose the Fibonacci line of 0.618 (0.00042649).
Target could be 0.00053905, but anything can happen on this way, that’s why I am going to update this chart until I am taking out my position.
ALWAYS keep in mind! That this is NOT an investment advice, but an analysis . You can do whatever you want with this information, so trade at your own risks!
Nota
I would wait out for a close below the fibonacci lineNota
The last pattern is a bullish pattern, the bullish Engulfing pattern. Which gives us an extra probability that Vechain will go upNota
New stop loss: .00046864Declinazione di responsabilità
Le informazioni ed i contenuti pubblicati non costituiscono in alcun modo una sollecitazione ad investire o ad operare nei mercati finanziari. Non sono inoltre fornite o supportate da TradingView. Maggiori dettagli nelle Condizioni d'uso.
Declinazione di responsabilità
Le informazioni ed i contenuti pubblicati non costituiscono in alcun modo una sollecitazione ad investire o ad operare nei mercati finanziari. Non sono inoltre fornite o supportate da TradingView. Maggiori dettagli nelle Condizioni d'uso.