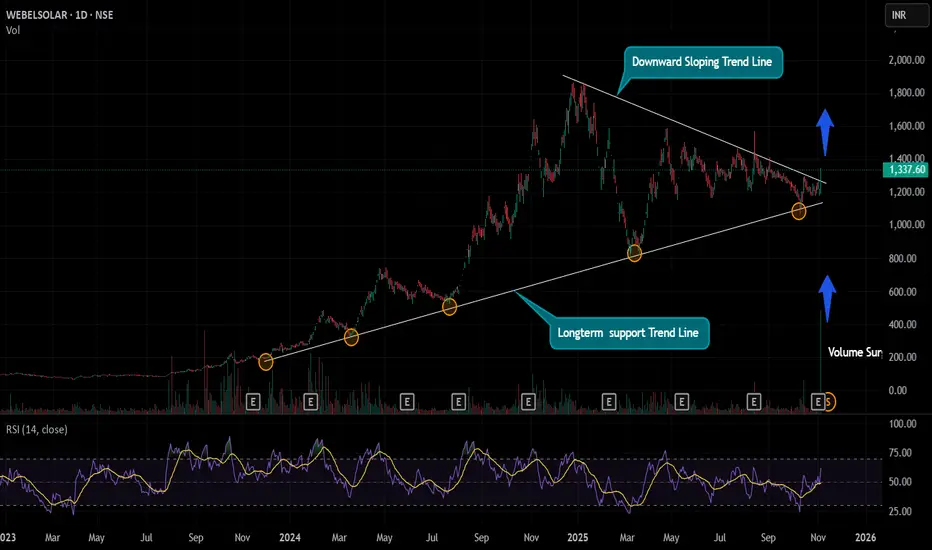
This is the daily chart of the Websol Energy System Ltd. The stock is respecting the 2 years upward sloping trendline and trying to come out of the resistance line with good volume.
Today the move was more than 10% with surge in the volume
RSI is above 60 indicating the price movement is strong.
If the stock stays above 1250 for couple of days than it could give a positive move in the short term.
Today the move was more than 10% with surge in the volume
RSI is above 60 indicating the price movement is strong.
If the stock stays above 1250 for couple of days than it could give a positive move in the short term.
Declinazione di responsabilità
Le informazioni e le pubblicazioni non sono intese come, e non costituiscono, consulenza o raccomandazioni finanziarie, di investimento, di trading o di altro tipo fornite o approvate da TradingView. Per ulteriori informazioni, consultare i Termini di utilizzo.
Declinazione di responsabilità
Le informazioni e le pubblicazioni non sono intese come, e non costituiscono, consulenza o raccomandazioni finanziarie, di investimento, di trading o di altro tipo fornite o approvate da TradingView. Per ulteriori informazioni, consultare i Termini di utilizzo.