Long
Three Paths, One Plan – Walmart (WMT) Weekly Battle Map
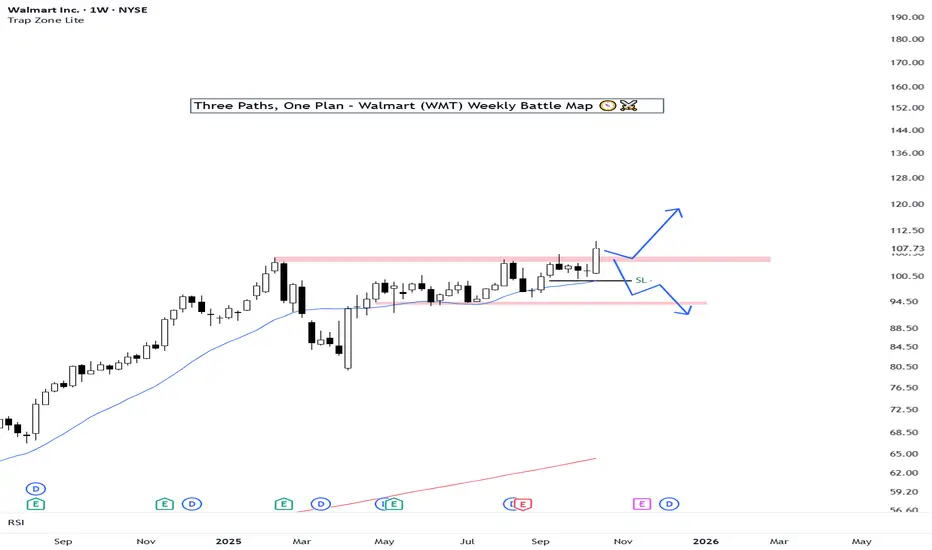
Walmart just broke to new all-time highs after building a strong base since February. This is a major technical moment — a clean structure that gives us three possible scenarios for the upcoming weeks:
🟢 Scenario 1 – Strong Breakout
Price keeps pushing higher with wide candles, confirming strength.
Plan: Stay long. Add on a clean retest of the pink zone if a color change confirms continuation.
Stop-Loss: Below the green line (~$101).
Target: $120–$125.
🟡 Scenario 2 – False Breakout / Loss of Momentum
If the next few candles stay small and the breakout fades, momentum dries up.
Plan: Reduce exposure or sell into a rebound to manage damage.
Defense Zone: $104–$105.
🔴 Scenario 3 – Stop & Reversal
If next week’s candle completely erases the breakout bar with a violent move, that triggers a reversal short.
Condition: Full candle wipeout with a close below the breakout body.
Target: Lower base of the range around $93 ±.
🎯 Final Take
As long as price holds above the pink zone ($105–$107), bias remains bullish.
Only a strong rejection and weekly close below $101 would confirm a reversal toward $93.
Shinobi Trading Lab – Indicators • Stats • Discipline
👉 Patreon: patreon.com/ShinobiTradingLab
👉 Patreon: patreon.com/ShinobiTradingLab
Declinazione di responsabilità
Le informazioni e le pubblicazioni non sono intese come, e non costituiscono, consulenza o raccomandazioni finanziarie, di investimento, di trading o di altro tipo fornite o approvate da TradingView. Per ulteriori informazioni, consultare i Termini di utilizzo.