Sharing a technical look and t he stock is showing signs of weakness — here’s the breakdown:
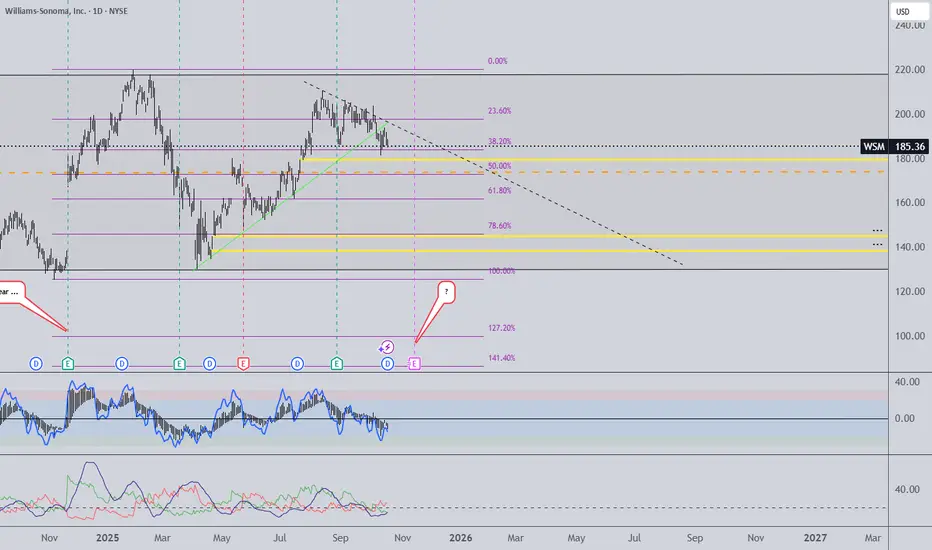
Price broke below a key ascending trendline (green line).
Now forming lower highs, potentially respecting a descending resistance line we got going .
Fibonacci levels following the bias of price moving in channel and surprisingly 50% could be the key element .
If this level breaks, next targets are the 61.8% retrace (~$162) and possibly the $150–145 zone (highlighted in yellow).
We can also see steady selling pressure — no clear reversal yet.
RSI is below 50, suggesting momentum is with the sellers.
No bullish divergence yet — so sellers still in control .
Dividend just paid (Oct 17) — stock often pulls back slightly afterward.
Important element here mid-November earnings — this could act as a major catalyst.
Not Financial Advice:
Just sharing the setup I’m watching. Risk is real — triggers matter. This one could show power of proper approach wit simple tools .
Declinazione di responsabilità
Le informazioni ed i contenuti pubblicati non costituiscono in alcun modo una sollecitazione ad investire o ad operare nei mercati finanziari. Non sono inoltre fornite o supportate da TradingView. Maggiori dettagli nelle Condizioni d'uso.
Declinazione di responsabilità
Le informazioni ed i contenuti pubblicati non costituiscono in alcun modo una sollecitazione ad investire o ad operare nei mercati finanziari. Non sono inoltre fornite o supportate da TradingView. Maggiori dettagli nelle Condizioni d'uso.