🏆 Gold: What is the right price to sell?
After receiving several messages asking “what would be a good level to start thinking about selling gold after this amazing rally?”, I’ve decided to prepare a post focused on long-term investing, even though I'm more focused in the short term opportunities.
In the short term, it’s clear for everyone here on TradingView, gold has broken out of a textbook ascending triangle and is pushing into new all-time highs 📈.
But… how far can this madness go!?!?
To answer, I’ve taken a long-term perspective, analyzing the monthly chart to give a broader view.
First of all, let me say that nobody knows exactly where gold will stop, and anyone who claims otherwise is lying. What I can do is highlight the levels that are more probable than others, based on technical patterns, Fibonacci extensions, and how gold has reacted to these in the past.
Gold has been one of the strongest long-term performers in financial history, and the monthly chart tells us that the story might be far from over.
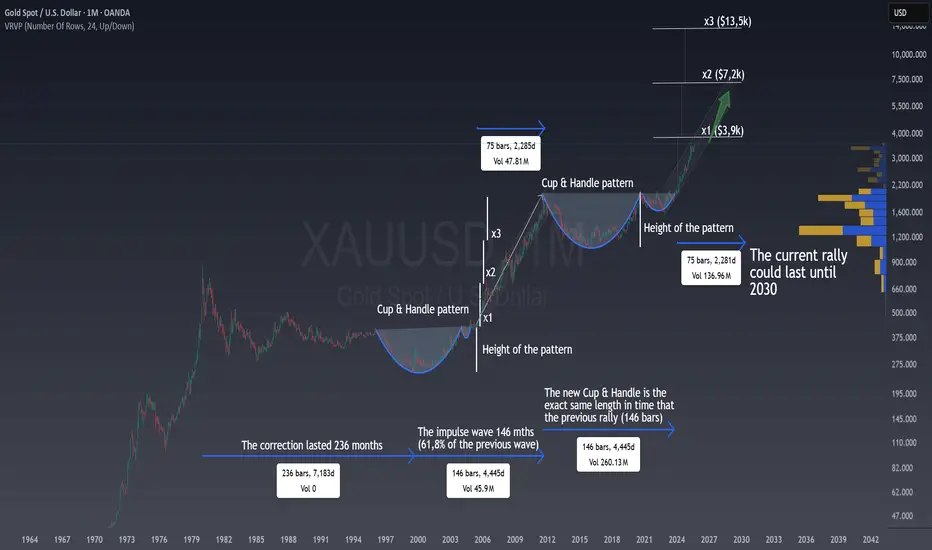
🔹 In the past, a Cup & Handle pattern pushed prices nearly 3x the height of the formation.
🔹 Right now, gold is completing another massive Cup & Handle, and we’re already near the x1 target ($3,900).
🔹 The rally could extend to x2 ($7,200) or even x3 ($13,500) until 2030.
⏳ The timing also aligns: the impulse wave after the last correction lasted 146 months, and this new rally is following a very similar time structure. According to the chart, this cycle could realistically stretch until 2030. Of course, with volatility but probably with a strong trend year after year.
👉 For long-term investors, this means:
Any deep correction = opportunity 🎯
Gold remains one of the best hedges against uncertainty 🌍
Patience could be rewarded with a historic move 🚀
I’m personally very bullish on gold’s long-term outlook, and I see this asset as a must-hold in a diversified portfolio. Corrections will come, but the structure suggests they’ll just be steps on the way higher. In the chart, you can also see a projection of the previous rally channel, Fibo time levels of the past correction being amazingly perfect and how it's realated with the current one, but it's not that important for the forecasted levels, so I don't want to overwhelm you :)
Furthermore, many countries have been shifting from sovereign debt to gold in their reserves, and this trend has been accelerating in recent years.
✨ The rally might just be getting started.
After receiving several messages asking “what would be a good level to start thinking about selling gold after this amazing rally?”, I’ve decided to prepare a post focused on long-term investing, even though I'm more focused in the short term opportunities.
In the short term, it’s clear for everyone here on TradingView, gold has broken out of a textbook ascending triangle and is pushing into new all-time highs 📈.
But… how far can this madness go!?!?
To answer, I’ve taken a long-term perspective, analyzing the monthly chart to give a broader view.
First of all, let me say that nobody knows exactly where gold will stop, and anyone who claims otherwise is lying. What I can do is highlight the levels that are more probable than others, based on technical patterns, Fibonacci extensions, and how gold has reacted to these in the past.
Gold has been one of the strongest long-term performers in financial history, and the monthly chart tells us that the story might be far from over.
🔹 In the past, a Cup & Handle pattern pushed prices nearly 3x the height of the formation.
🔹 Right now, gold is completing another massive Cup & Handle, and we’re already near the x1 target ($3,900).
🔹 The rally could extend to x2 ($7,200) or even x3 ($13,500) until 2030.
⏳ The timing also aligns: the impulse wave after the last correction lasted 146 months, and this new rally is following a very similar time structure. According to the chart, this cycle could realistically stretch until 2030. Of course, with volatility but probably with a strong trend year after year.
👉 For long-term investors, this means:
Any deep correction = opportunity 🎯
Gold remains one of the best hedges against uncertainty 🌍
Patience could be rewarded with a historic move 🚀
I’m personally very bullish on gold’s long-term outlook, and I see this asset as a must-hold in a diversified portfolio. Corrections will come, but the structure suggests they’ll just be steps on the way higher. In the chart, you can also see a projection of the previous rally channel, Fibo time levels of the past correction being amazingly perfect and how it's realated with the current one, but it's not that important for the forecasted levels, so I don't want to overwhelm you :)
Furthermore, many countries have been shifting from sovereign debt to gold in their reserves, and this trend has been accelerating in recent years.
✨ The rally might just be getting started.
⚡ Trading is not about luck or patience. Is about skills and knowledge. ⚡
I share my ideas, returns and knowledge here:
📚 👉 topchartpatterns.substack.com/subscribe 👈📚
🤝 Business contact: info@topchartpatterns.com
I share my ideas, returns and knowledge here:
📚 👉 topchartpatterns.substack.com/subscribe 👈📚
🤝 Business contact: info@topchartpatterns.com
Pubblicazioni correlate
Declinazione di responsabilità
Le informazioni ed i contenuti pubblicati non costituiscono in alcun modo una sollecitazione ad investire o ad operare nei mercati finanziari. Non sono inoltre fornite o supportate da TradingView. Maggiori dettagli nelle Condizioni d'uso.