Took a buy on the bullish retest as price is in major downtrend.
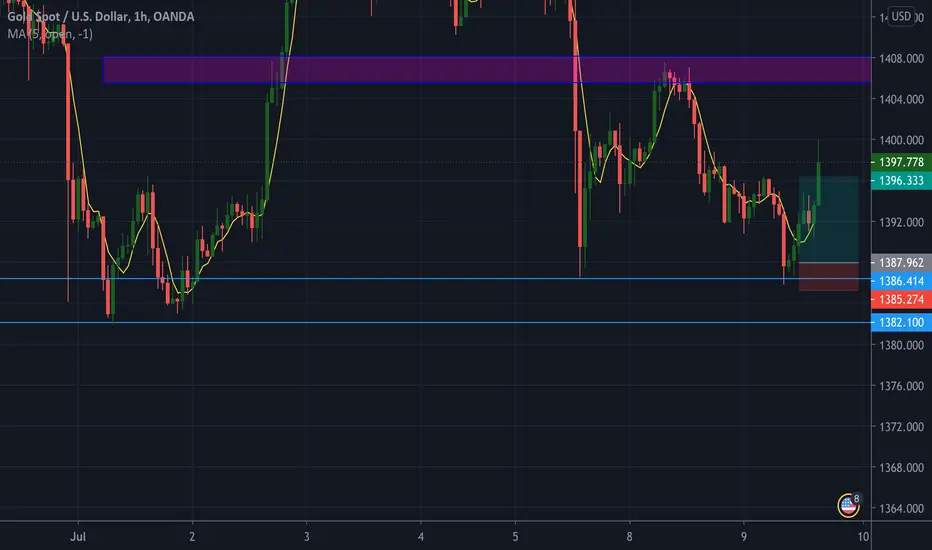
Now looking at the Gold/USD hourly & 15 min charts on July 9th 2019. Gold has been in a bearish trend since July 3rd, after reaching 6 year high at 1438.900 zone. Going to a higher timeframe, in the daily, we see that price could Not top this high after attempting to breakthrough twice. Once on June 25th & again on July 3rd ( 5 candles in between).
Price has been creating lower highs & lower lows since the 3rd of July, indicating down trend. 3 bearish candles appear after not being able to break high. With price currently at 1397.778 I am now looking for sells down to the 1382.100 zone after retest.
Using the Fibonacci retracement tool, I will set my tp & sl respecting its support & resistance levels.
Declinazione di responsabilità
Le informazioni ed i contenuti pubblicati non costituiscono in alcun modo una sollecitazione ad investire o ad operare nei mercati finanziari. Non sono inoltre fornite o supportate da TradingView. Maggiori dettagli nelle Condizioni d'uso.
Declinazione di responsabilità
Le informazioni ed i contenuti pubblicati non costituiscono in alcun modo una sollecitazione ad investire o ad operare nei mercati finanziari. Non sono inoltre fornite o supportate da TradingView. Maggiori dettagli nelle Condizioni d'uso.