✅ From the 4-hour chart, gold remains in an overall bearish correction structure.
MA5 and MA10 have formed a bearish crossover and continue to suppress the candlesticks, indicating that the short-term rebound is limited.
MA20 is located near 4097, acting as significant resistance. As long as the price fails to stabilize above this level, the bearish structure will not change.
The Bollinger Bands show a downward opening, reflecting a weak trend.
Price previously broke below the lower band (around 3980) and although it has since rebounded, it still remains below the middle band.
Gold has repeatedly tested the 3997–4000 support zone and formed brief rebounds, but the strength is weak — this is still technical correction rather than a trend reversal.
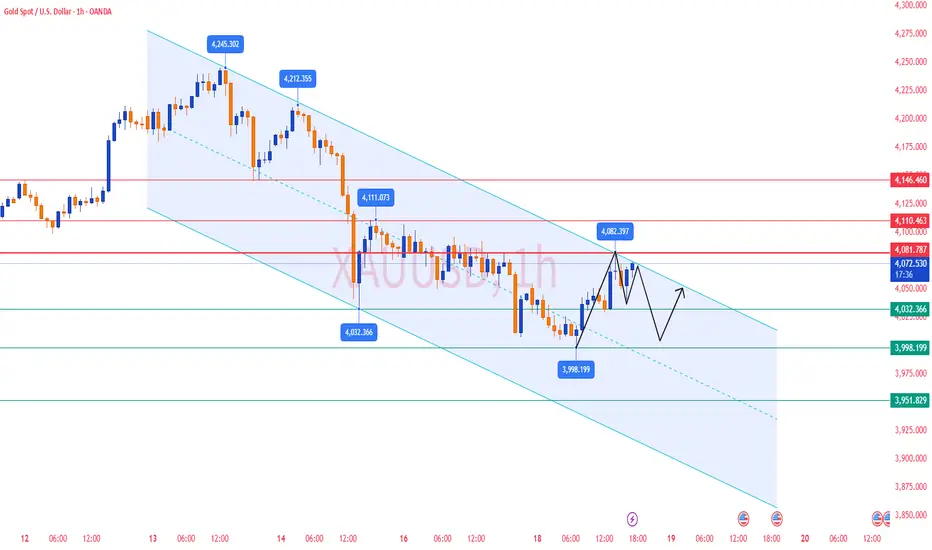
✅ On the 1-hour chart, gold shows a clear short-term rebound correction.
Price has broken above MA5 and MA10 and is holding above the short-term moving averages, indicating strengthening rebound momentum.
The upper resistance comes from the Bollinger upper band at 4075–4078, an area where gold has repeatedly been rejected.
MA20 (around 4036–4040) has shifted from resistance to short-term support.
As long as this level holds, the 1-hour structure still has room to extend the rebound.
Long lower wicks and concentrated trading around 4050–4060 suggest that buyers are trying to establish a short-term base.
However, the short-term rebound has not changed the bigger bearish structure.
If gold fails to break through 4075–4080, the rebound may end and the price could return to its bearish rhythm.
🔴 Resistance Levels: 4075–4080 / 4100–4108 / 4150
🟢 Support Levels: 4036–4040 / 4000–3997 / 3953
✅ Trading Strategy Reference
🔰 Strategy 1 — Look for short positions near resistance (trend-following):
If gold rebounds to 4075–4080 and shows rejection:
Consider taking light short positions
Stop Loss: above 4088
Targets: 4050 → 4035 → 4000
👉 This zone combines multiple moving-average resistance and the Bollinger upper band, making it a high-probability area for trend-following shorts.
🔰 Strategy 2 — Short-term long positions from support (countertrend, light positions):
If gold pulls back to 4035–4040 and stabilizes:
Consider a short-term long position
Stop Loss: below 4030
Targets: 4060 → 4075
👉 This is only a corrective rebound trade — not suitable for large positions.
🔰 Strategy 3 — If gold breaks below 4000, downside may accelerate:
A break below 3997–4000 could trigger a stronger sell-off, with targets toward:3953 → 3920
✅ Summary
Gold remains in a bearish, downward-dominated structure, and the current rebound is still a weak correction.
As long as the price remains suppressed below 4080–4100, the bearish trend remains intact.
MA5 and MA10 have formed a bearish crossover and continue to suppress the candlesticks, indicating that the short-term rebound is limited.
MA20 is located near 4097, acting as significant resistance. As long as the price fails to stabilize above this level, the bearish structure will not change.
The Bollinger Bands show a downward opening, reflecting a weak trend.
Price previously broke below the lower band (around 3980) and although it has since rebounded, it still remains below the middle band.
Gold has repeatedly tested the 3997–4000 support zone and formed brief rebounds, but the strength is weak — this is still technical correction rather than a trend reversal.
✅ On the 1-hour chart, gold shows a clear short-term rebound correction.
Price has broken above MA5 and MA10 and is holding above the short-term moving averages, indicating strengthening rebound momentum.
The upper resistance comes from the Bollinger upper band at 4075–4078, an area where gold has repeatedly been rejected.
MA20 (around 4036–4040) has shifted from resistance to short-term support.
As long as this level holds, the 1-hour structure still has room to extend the rebound.
Long lower wicks and concentrated trading around 4050–4060 suggest that buyers are trying to establish a short-term base.
However, the short-term rebound has not changed the bigger bearish structure.
If gold fails to break through 4075–4080, the rebound may end and the price could return to its bearish rhythm.
🔴 Resistance Levels: 4075–4080 / 4100–4108 / 4150
🟢 Support Levels: 4036–4040 / 4000–3997 / 3953
✅ Trading Strategy Reference
🔰 Strategy 1 — Look for short positions near resistance (trend-following):
If gold rebounds to 4075–4080 and shows rejection:
Consider taking light short positions
Stop Loss: above 4088
Targets: 4050 → 4035 → 4000
👉 This zone combines multiple moving-average resistance and the Bollinger upper band, making it a high-probability area for trend-following shorts.
🔰 Strategy 2 — Short-term long positions from support (countertrend, light positions):
If gold pulls back to 4035–4040 and stabilizes:
Consider a short-term long position
Stop Loss: below 4030
Targets: 4060 → 4075
👉 This is only a corrective rebound trade — not suitable for large positions.
🔰 Strategy 3 — If gold breaks below 4000, downside may accelerate:
A break below 3997–4000 could trigger a stronger sell-off, with targets toward:3953 → 3920
✅ Summary
Gold remains in a bearish, downward-dominated structure, and the current rebound is still a weak correction.
As long as the price remains suppressed below 4080–4100, the bearish trend remains intact.
Declinazione di responsabilità
Le informazioni e le pubblicazioni non sono intese come, e non costituiscono, consulenza o raccomandazioni finanziarie, di investimento, di trading o di altro tipo fornite o approvate da TradingView. Per ulteriori informazioni, consultare i Termini di utilizzo.
Declinazione di responsabilità
Le informazioni e le pubblicazioni non sono intese come, e non costituiscono, consulenza o raccomandazioni finanziarie, di investimento, di trading o di altro tipo fornite o approvate da TradingView. Per ulteriori informazioni, consultare i Termini di utilizzo.