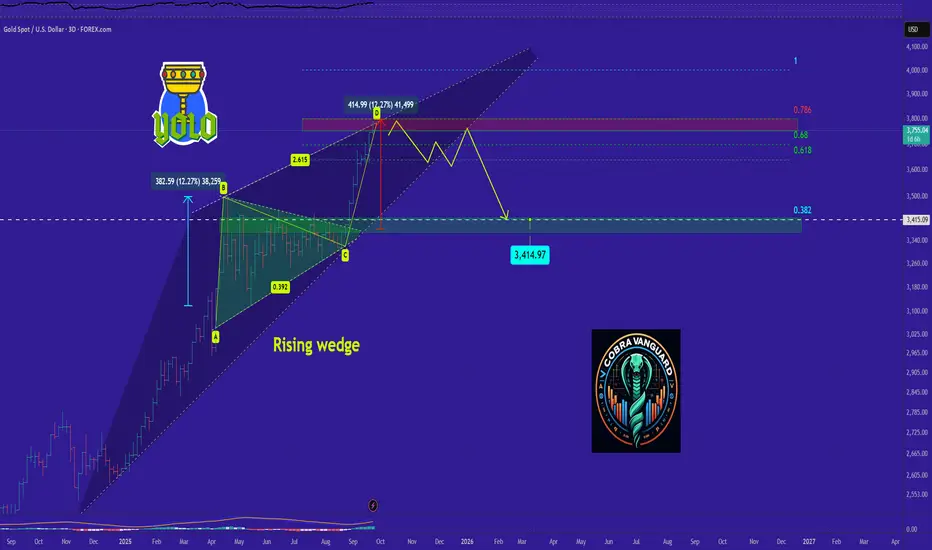
As you can see, the price is within a descending wedge, and it has reached the upper boundary of this wedge. According to technical analysis patterns, the price has closely followed the AB=CD pattern, indicating a need for a slight correction. In the coming days, the price may range within this wedge, and if the pattern breaks, the price could drop to the Fibonacci levels shown.
📥┃Telegram: t.me/CobraVanguard
📥┃Instagram: instagram.com/cobravanguard
📥┃Advert/Partnership: t.me/Cobravanguardsupport
📥┃Get access to the private club with VIP signals: t.me/Cobravanguardsupport
📥┃Instagram: instagram.com/cobravanguard
📥┃Advert/Partnership: t.me/Cobravanguardsupport
📥┃Get access to the private club with VIP signals: t.me/Cobravanguardsupport
Pubblicazioni correlate
Declinazione di responsabilità
Le informazioni ed i contenuti pubblicati non costituiscono in alcun modo una sollecitazione ad investire o ad operare nei mercati finanziari. Non sono inoltre fornite o supportate da TradingView. Maggiori dettagli nelle Condizioni d'uso.