✅ Recently, gold has repeatedly shown sharp one-sided moves, with several swings exceeding $80 in both directions this week, forming typical V-shaped reversals. Friday’s rapid decline reflected heavy short-term profit-taking at the highs, signaling that the market has entered a strong corrective consolidation phase.
✅ 4-Hour Chart:
After peaking at 4379.52, gold pulled back sharply and is now trading below the Bollinger mid-band, stabilizing around 4230–4250.
🔹Moving Averages: MA5 and MA10 have formed a bearish crossover, and MA20 has begun to turn down, showing short-term weakness; MA60 and MA120 remain upward-sloping, indicating that the medium- to long-term structure is still bullish.
🔹Bollinger Bands: Upper band near 4364, middle at 4237, lower at 4111. Price is oscillating below the mid-band; failure to reclaim it could lead to a test of the 4110–4150 zone.
Overall, gold is in a high-level correction phase dominated by short sellers. Unless it can hold above 4237, further testing of 4180–4150 remains likely.
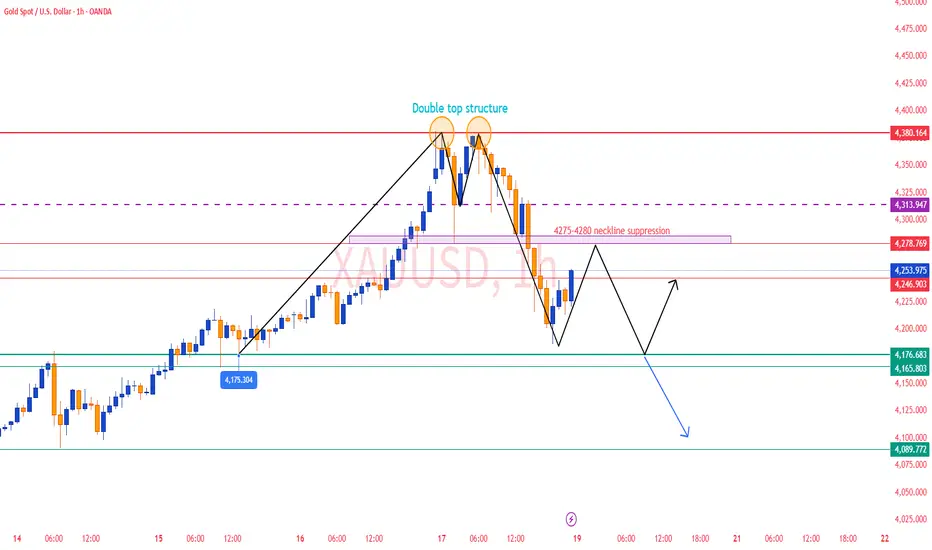
✅ 1-Hour Chart:
After retreating from the 4379.52 high to a 4186.62 low, gold saw a weak rebound capped near 4240, forming a classic double-top around 4379. The short-term trend has turned bearish, and the 4280 region now acts as key resistance.
🔴 Resistance Levels: 4275–4280 / 4300
🟢 Support Levels: 4180–4160 / 4090
✅ Trading Strategy Reference:
🔰 If the price rebounds to 4275–4280 and faces resistance, consider light short positions with targets at 4180–4160, stop loss above 4300.
🔰 If the price dips to around 4175–4180 and stabilizes, consider cautious long entries with targets at 4250–4270, stop loss below 4160.
📊 Summary:
Gold’s short-term trend remains weak, representing a technical correction after a strong rally. As long as 4160–4180 support holds, the medium-term bullish structure remains intact. Failure to break above 4280–4300 will keep the market in a weak consolidation phase, with secondary support around 4110–4090.
✅ 4-Hour Chart:
After peaking at 4379.52, gold pulled back sharply and is now trading below the Bollinger mid-band, stabilizing around 4230–4250.
🔹Moving Averages: MA5 and MA10 have formed a bearish crossover, and MA20 has begun to turn down, showing short-term weakness; MA60 and MA120 remain upward-sloping, indicating that the medium- to long-term structure is still bullish.
🔹Bollinger Bands: Upper band near 4364, middle at 4237, lower at 4111. Price is oscillating below the mid-band; failure to reclaim it could lead to a test of the 4110–4150 zone.
Overall, gold is in a high-level correction phase dominated by short sellers. Unless it can hold above 4237, further testing of 4180–4150 remains likely.
✅ 1-Hour Chart:
After retreating from the 4379.52 high to a 4186.62 low, gold saw a weak rebound capped near 4240, forming a classic double-top around 4379. The short-term trend has turned bearish, and the 4280 region now acts as key resistance.
🔴 Resistance Levels: 4275–4280 / 4300
🟢 Support Levels: 4180–4160 / 4090
✅ Trading Strategy Reference:
🔰 If the price rebounds to 4275–4280 and faces resistance, consider light short positions with targets at 4180–4160, stop loss above 4300.
🔰 If the price dips to around 4175–4180 and stabilizes, consider cautious long entries with targets at 4250–4270, stop loss below 4160.
📊 Summary:
Gold’s short-term trend remains weak, representing a technical correction after a strong rally. As long as 4160–4180 support holds, the medium-term bullish structure remains intact. Failure to break above 4280–4300 will keep the market in a weak consolidation phase, with secondary support around 4110–4090.
Declinazione di responsabilità
Le informazioni ed i contenuti pubblicati non costituiscono in alcun modo una sollecitazione ad investire o ad operare nei mercati finanziari. Non sono inoltre fornite o supportate da TradingView. Maggiori dettagli nelle Condizioni d'uso.
Declinazione di responsabilità
Le informazioni ed i contenuti pubblicati non costituiscono in alcun modo una sollecitazione ad investire o ad operare nei mercati finanziari. Non sono inoltre fornite o supportate da TradingView. Maggiori dettagli nelle Condizioni d'uso.