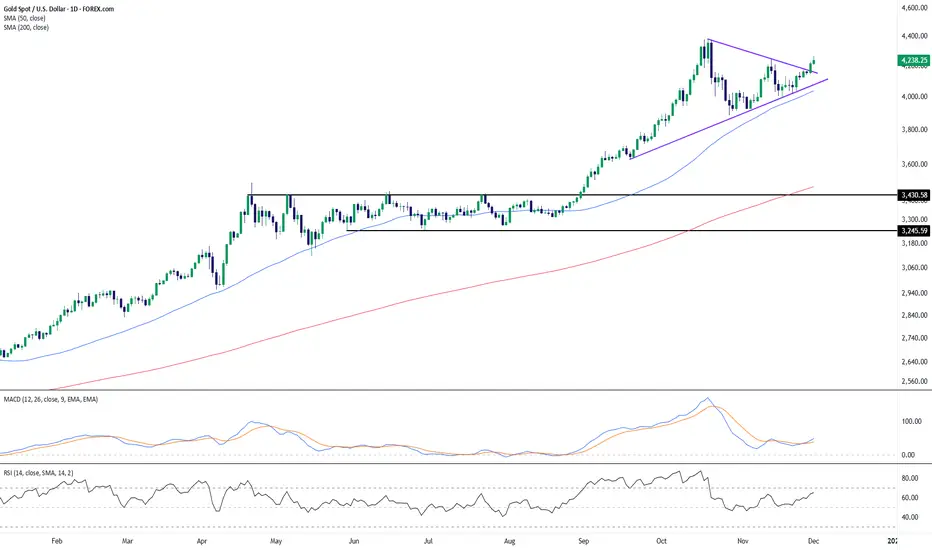
Gold has pushed through the upper boundary of a contracting triangle formation, marking a continuation of the broader uptrend that has been intact since early in the year. The breakout follows several weeks of compression, with progressively higher lows aligning along a rising trendline, while buyers repeatedly tested the upper diagonal boundary.
The moving averages reinforce the constructive bias: price continues to trade well above both the 50-day SMA and the 200-day SMA, with the 50-day maintaining a strong upward slope. This places the current move firmly within a longer-term bullish structure, and the recent expansion in distance from the 50-day SMA highlights renewed upward momentum following the consolidation phase.
Momentum indicators are also showing early signs of improvement. The MACD lines have begun curling higher after a period of easing, suggesting that downside momentum has faded. RSI has climbed back into the mid-60s, reflecting strengthening buying interest without yet indicating overstretched conditions.
Overall, the breakout from the triangle aligns with the prevailing uptrend and indicates a return of bullish pressure. As always, how price behaves on any retest of the breakout area—or near the rising trendline—may provide additional insight into the durability of this momentum shift.
-MW
Declinazione di responsabilità
Le informazioni e le pubblicazioni non sono intese come, e non costituiscono, consulenza o raccomandazioni finanziarie, di investimento, di trading o di altro tipo fornite o approvate da TradingView. Per ulteriori informazioni, consultare i Termini di utilizzo.
Declinazione di responsabilità
Le informazioni e le pubblicazioni non sono intese come, e non costituiscono, consulenza o raccomandazioni finanziarie, di investimento, di trading o di altro tipo fornite o approvate da TradingView. Per ulteriori informazioni, consultare i Termini di utilizzo.