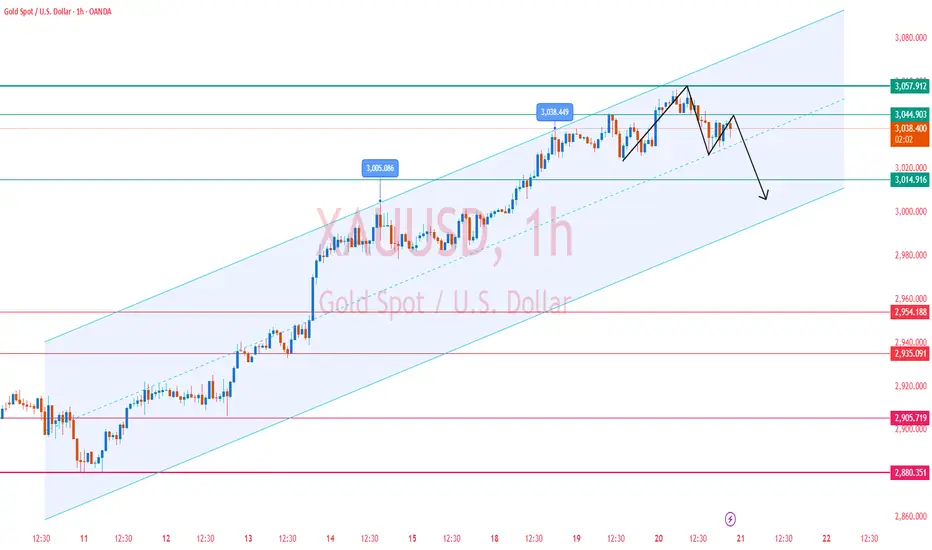
✅In the early Asian session today, the gold price quickly rose to 3056 and then came under significant pressure, forming a double top structure during the session. After the opening of the US session, the price has fallen back to around 3025, verifying the effectiveness of high-level selling pressure.
✅Currently, gold is showing a high-level downward trend in the 1-hour cycle. If the price continues to fall and rebounds but fails to break through the new high, it may gradually form the prototype of a head and shoulders top pattern. Overall, gold is in a high-level decline stage, and market sentiment tends to be cautious. Do not blindly chase more.
✅The current upper resistance is in the 3042-3045 range, which is also the watershed between long and short positions. If the upward breakthrough fails, it means that there may be a further correction tomorrow. If it can successfully break through today, a new high may appear.
✅Short-term Key price points
🔴Upper resistance level:
-First: 3045-3050
-Second: 3038-3042
🟢Lower support level:
-First: 3020-3022
-Second: 3005-3012
✅Intraday trading strategy
🔰Aggressive strategy
--Entry: Rebound to 3038-3042 and try short with a light position (position ≤ 3%)
--Stop loss: 3047 (break through the previous high + 0.5 times ATR)
--Target: 3022→3008 (1:3 risk-reward ratio)
🔰Solid strategy
--Wait for the price to test the 3020-3022 support band:
--If there is a bullish engulfing + RSI bottom divergence, enter a long order (stop loss 3015)
-- If the volume falls below 3018, chase the short to 3005 (stop loss 3025)
🔷Trading strategies are time-sensitive. We will provide real-time and accurate trading strategies based on market changes. Please stay tuned.
🔶The current market situation is in a high-risk state. Trading on your own may result in huge losses. Our professional guidance can help you avoid risks while obtaining continuous and stable profits🤝
Trade attivo
✅The gold price formed a significant top structure at 3047 in the early trading, and the 4-hour chart closed three consecutive real negative lines. A typical bearish engulfing pattern appeared: the last negative line entity completely covered the previous positive line entity, and the entity accounted for more than 70%. The rebound momentum was exhausted, and the price showed the characteristics of "high point moving down, low point moving down" in the key resistance area.✅Key price level analysis
🔴Resistance area
--Primary resistance: 3047-3050 (previous high + integer level)
--Secondary resistance: 3035 (Asian session rebound high, now converted into dynamic resistance)
🟢Support area
--Intraday support: 3025-3020 (overnight low + Fibonacci 38.2% retracement level)
--Strong support band: 3005-3000 (psychological level + 50% retracement level + EMA60)
✅Intraday trading strategy:
🔰Short when rebounding to 3045-3050 area, stop loss set above 3055
Target positions look down to 3035/3025/3015 in turn
🔰If it effectively breaks below 3020, you can short with a light position to the 3005-3000 area
🔰When the 3005-3000 support band is touched for the first time, you can try to rebound long orders, with a stop loss below 2995
Declinazione di responsabilità
Le informazioni ed i contenuti pubblicati non costituiscono in alcun modo una sollecitazione ad investire o ad operare nei mercati finanziari. Non sono inoltre fornite o supportate da TradingView. Maggiori dettagli nelle Condizioni d'uso.
Declinazione di responsabilità
Le informazioni ed i contenuti pubblicati non costituiscono in alcun modo una sollecitazione ad investire o ad operare nei mercati finanziari. Non sono inoltre fornite o supportate da TradingView. Maggiori dettagli nelle Condizioni d'uso.