✅ 4H Chart Trend Analysis
1️⃣ Lower rebound highs, weakening bullish momentum
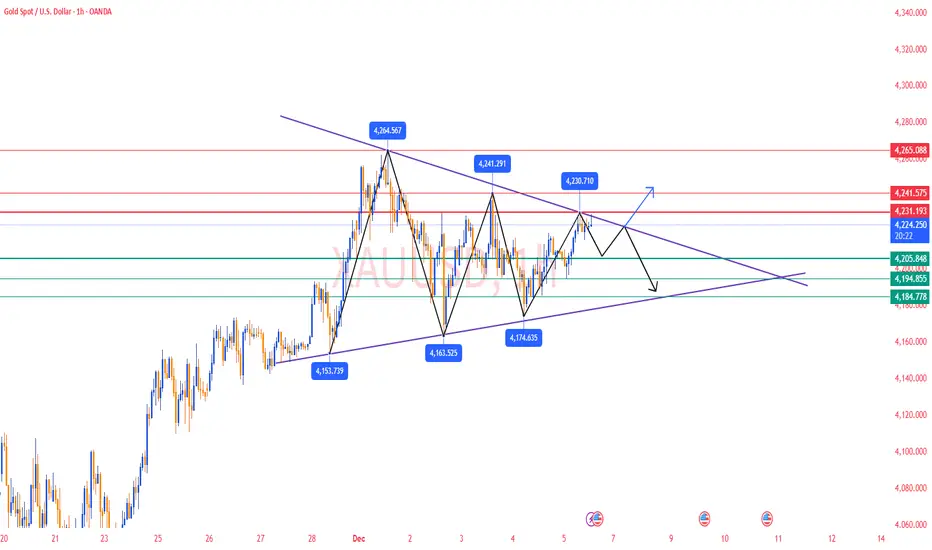
Highs are stepping down from 4264.62 → 4241.55 → 4230, showing repeated rejection and forming an early descending high structure at the top.
2️⃣ Bollinger Middle Band as strong resistance
Current rebound is capped around 4227 mid-band
➡️ If price continues to fail breaking above → mid-term remains in consolidation
3️⃣ Moving averages indicate weak recovery
MA5 & MA10 are turning upward, but MA20 is flat
➡️ This suggests rebound = correction, not reversal
If price fails to break 4241–4245, strong bullish momentum will not be restored.
✅ 1H Chart Trend Analysis
1️⃣ Consecutive closes below 4227 with long upper shadows
➡ Bullish profit-taking at high levels
➡ Clear overhead selling pressure
2️⃣ Short-term MAs converging
MA5 / MA10 / MA20 are compressing together
➡ Momentum weakening → entering sideways consolidation
3️⃣ Bollinger Bands turning sideways
Price failing to ride the upper band → easy to shift into pullback mode
🔴 Resistance Levels :4227–4230 / 4240–4245
🟢 Support Levels:4205–4208 / 4185–4180
✅Trading Strategy Reference
🔰 Main Strategy: Sell the Rebound
📍Entry Zone: 4225–4230
🎯Targets: 4210 / 4195 / 4185
⛔Stop-loss: Above 4235
🔰 Secondary Strategy: Buy the Dip
📍If 4205–4208 holds, consider light longs
🎯Targets: 4220 / 4227
⛔Stop-loss: Below 4198
📌 Trend Summary
1️⃣ If 4205 breaks with strong selling volume → downside targets: 4188 / 4163
2️⃣ If price stabilizes above 4227 with bullish volume →
Bulls regain control → target 4245+
🎯 Key focus: Whether the 4205–4208 support zone remains intact
🔥Trading Reminder: Trading strategies are time-sensitive, and market conditions can change rapidly. Please adjust your trading plan based on real-time market conditions.
1️⃣ Lower rebound highs, weakening bullish momentum
Highs are stepping down from 4264.62 → 4241.55 → 4230, showing repeated rejection and forming an early descending high structure at the top.
2️⃣ Bollinger Middle Band as strong resistance
Current rebound is capped around 4227 mid-band
➡️ If price continues to fail breaking above → mid-term remains in consolidation
3️⃣ Moving averages indicate weak recovery
MA5 & MA10 are turning upward, but MA20 is flat
➡️ This suggests rebound = correction, not reversal
If price fails to break 4241–4245, strong bullish momentum will not be restored.
✅ 1H Chart Trend Analysis
1️⃣ Consecutive closes below 4227 with long upper shadows
➡ Bullish profit-taking at high levels
➡ Clear overhead selling pressure
2️⃣ Short-term MAs converging
MA5 / MA10 / MA20 are compressing together
➡ Momentum weakening → entering sideways consolidation
3️⃣ Bollinger Bands turning sideways
Price failing to ride the upper band → easy to shift into pullback mode
🔴 Resistance Levels :4227–4230 / 4240–4245
🟢 Support Levels:4205–4208 / 4185–4180
✅Trading Strategy Reference
🔰 Main Strategy: Sell the Rebound
📍Entry Zone: 4225–4230
🎯Targets: 4210 / 4195 / 4185
⛔Stop-loss: Above 4235
🔰 Secondary Strategy: Buy the Dip
📍If 4205–4208 holds, consider light longs
🎯Targets: 4220 / 4227
⛔Stop-loss: Below 4198
📌 Trend Summary
1️⃣ If 4205 breaks with strong selling volume → downside targets: 4188 / 4163
2️⃣ If price stabilizes above 4227 with bullish volume →
Bulls regain control → target 4245+
🎯 Key focus: Whether the 4205–4208 support zone remains intact
🔥Trading Reminder: Trading strategies are time-sensitive, and market conditions can change rapidly. Please adjust your trading plan based on real-time market conditions.
✅ 𝐃𝐚𝐢𝐥𝐲 𝟐-𝟒 𝐓𝐫𝐚𝐝𝐢𝐧𝐠 𝐒𝐢𝐠𝐧𝐚𝐥𝐬 🔥
✅ 𝐇𝐢𝐠𝐡 𝐀𝐜𝐜𝐮𝐫𝐚𝐜𝐲 𝟗𝟎%-𝟗𝟓% 🔥
✅ 𝐌𝐨𝐧𝐭𝐡𝐥𝐲 𝐏𝐫𝐨𝐟𝐢𝐭 𝟑𝟓𝟎𝟎 𝐏𝐈𝐏𝐒 🔥
💎 𝐏𝐫𝐨𝐟𝐞𝐬𝐬𝐢𝐨𝐧𝐚𝐥 𝐅𝐫𝐞𝐞 𝐆𝐫𝐨𝐮𝐩:t.me/+YgFaky2XQ7ViYWE9
✅ 𝐇𝐢𝐠𝐡 𝐀𝐜𝐜𝐮𝐫𝐚𝐜𝐲 𝟗𝟎%-𝟗𝟓% 🔥
✅ 𝐌𝐨𝐧𝐭𝐡𝐥𝐲 𝐏𝐫𝐨𝐟𝐢𝐭 𝟑𝟓𝟎𝟎 𝐏𝐈𝐏𝐒 🔥
💎 𝐏𝐫𝐨𝐟𝐞𝐬𝐬𝐢𝐨𝐧𝐚𝐥 𝐅𝐫𝐞𝐞 𝐆𝐫𝐨𝐮𝐩:t.me/+YgFaky2XQ7ViYWE9
Declinazione di responsabilità
Le informazioni e le pubblicazioni non sono intese come, e non costituiscono, consulenza o raccomandazioni finanziarie, di investimento, di trading o di altro tipo fornite o approvate da TradingView. Per ulteriori informazioni, consultare i Termini di utilizzo.