1. Market Structure & Technical Setup
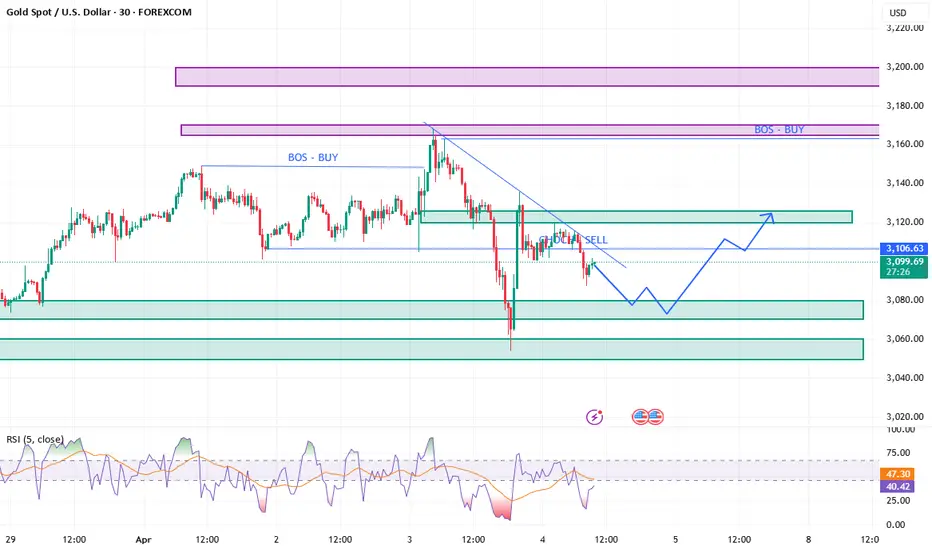
Recent technical charts for gold (XAU/USD) indicate that the price has been forming a pattern characterized by higher highs and higher lows. This type of price action suggests that, despite periods of consolidation, there is an underlying bullish trend. Notably, a shorter-term moving average (such as the 20-period SMA) appears to be acting as a dynamic support, helping to cushion short-term price declines. In contrast, longer-term moving averages (like the 100 SMA and 200 SMA) provide a broader view of the trend and help traders confirm the overall bias of the market.
In technical terms, the market has been consolidating around key support levels—for example, areas observed near price levels such as ~$2,985, ~$3,000, and ~$3,015. At the same time, resistance levels exist around the ~$3,030–$3,060 region. This consolidation phase is often interpreted as the market preparing for a potential breakout upward, particularly if the price successfully breaches these resistance levels.
2. Fundamental Drivers
On the fundamental side, gold remains significantly influenced by global economic factors:
Given these factors, even though technical indicators point to a bullish trend over the longer term, short-term fluctuations can occur due to shifts in economic data or geopolitical events.
3. Trading Implications & Caution
For traders, the current analysis suggests a cautiously optimistic outlook on gold. The consolidation phase near key support and resistance levels might signal an imminent upward breakout. However, it’s important to note:
Conclusion
In summary, the current gold market analysis reveals a market that is technically poised for upward movement, with a bullish long-term cue indicated by higher highs and higher lows, and critical support levels offered by dynamic moving averages. Yet, one should remain cautious due to possible short-term volatility fueled by economic and geopolitical events. By complementing technical analysis with fundamental insights, traders can form a more balanced view and make informed decisions.
If you’d like further discussion on how to integrate this analysis into a trading strategy or need additional insights on specific technical indicators, we can dive deeper into those aspects as well.
Declinazione di responsabilità
Le informazioni ed i contenuti pubblicati non costituiscono in alcun modo una sollecitazione ad investire o ad operare nei mercati finanziari. Non sono inoltre fornite o supportate da TradingView. Maggiori dettagli nelle Condizioni d'uso.
Declinazione di responsabilità
Le informazioni ed i contenuti pubblicati non costituiscono in alcun modo una sollecitazione ad investire o ad operare nei mercati finanziari. Non sono inoltre fornite o supportate da TradingView. Maggiori dettagli nelle Condizioni d'uso.