Market Overview
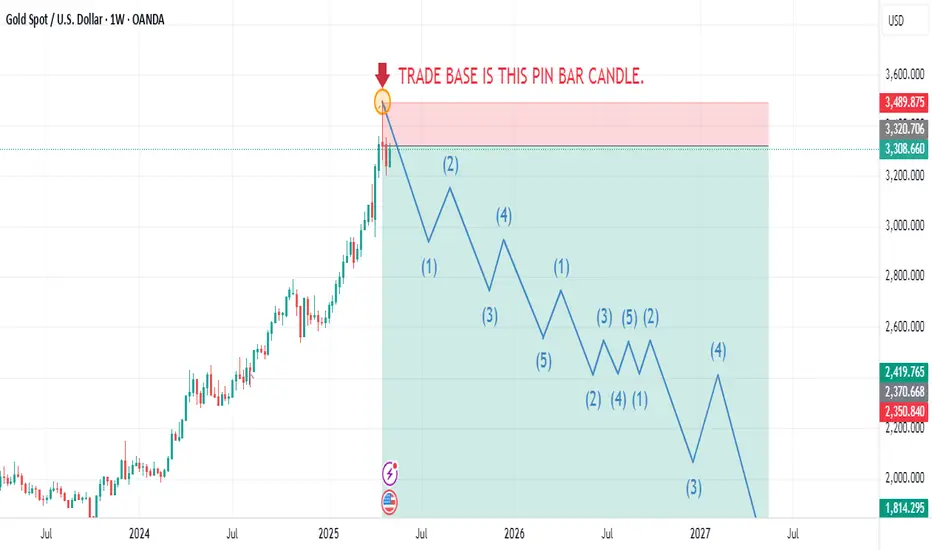
Gold (XAU/USD) has exhibited a bullish rally in recent times, but a recent pin bar formation on the weekly chart signals a potential reversal. With a 95% confidence level based on technical analysis, the market is poised for a significant downturn over the next two years. The current momentum remains slightly bullish, but failure to breach the $3,500.00 resistance level will likely trigger a substantial decline in gold prices, making it an opportune moment for swing traders to consider short positions.
Price Predictions
Based on the provided projections, the following key price levels are anticipated for gold over the next two years:
Mid-July 2025: Gold prices are expected to peak near $3,000.00, marking a potential high for the year.
Mid-November 2025: Prices are forecasted to decline to approximately $2,740.00.
End of March 2026: A further drop is anticipated, with prices reaching around $2,560.00.
End of June 2026: Gold is expected to form a low around $2,408.00.
June to September 2026: The market is likely to trade in a range-bound pattern, with no significant directional movement.
End of September 2026: A breakout from the range is expected, potentially setting the stage for further declines.
End of December 2026: Gold prices are projected to fall to approximately $2,053.00.
April 2027: The downtrend is expected to continue, with prices dropping to around $1,814.00.
Technical Analysis
The recent pin bar on the weekly chart is a strong bearish signal, indicating rejection at higher price levels. This suggests that the bullish rally may have exhausted its momentum. The critical resistance level to watch is $3,500.00. If gold fails to break above this level, it will likely confirm the bearish outlook, leading to a sustained decline. The projected price levels align with key support zones, reinforcing the potential for a prolonged downtrend.
Swing Trading Strategy
Swing traders can capitalize on this bearish outlook by initiating short positions at strategic price points. Below is a suggested approach:
Entry Point: Consider entering a short trade near $3,000.00 in mid-July 2025, as prices approach the projected peak. Alternatively, wait for a confirmation of rejection at $3,500.00 if prices rally higher.
Stop Loss: Place a stop loss above $3,500.00 to protect against an unexpected bullish breakout.
Take Profit Levels:
First target: $2,740.00 (mid-November 2025).
Second target: $2,560.00 (end of March 2026).
Long-term target: $2,053.00 (end of December 2026) or $1,814.00 (April 2027).
Position Sizing: Use proper risk management, risking no more than 1-2% of the trading account per trade.
Monitoring: Watch for range-bound movement between June and September 2026, as this may require adjusting positions or temporarily exiting the trade.
Risk Factors
While the bearish outlook is supported by technical signals, traders should remain cautious of the following risks:
Geopolitical Events: Sudden global events could drive safe-haven demand for gold, pushing prices higher.
Economic Data: Changes in interest rates or inflation could influence gold prices unexpectedly.
Market Sentiment: A shift in investor sentiment could delay or alter the projected downtrend.
Conclusion
The formation of a pin bar on the weekly chart, combined with the failure to break $3,500.00, suggests that gold’s bullish rally is likely over. Swing traders can take advantage of the anticipated downtrend by shorting gold at key resistance levels and targeting the projected price declines over the next two years. By employing disciplined risk management and closely monitoring market developments, traders can position themselves for significant returns as gold prices trend lower.
Declinazione di responsabilità
Le informazioni ed i contenuti pubblicati non costituiscono in alcun modo una sollecitazione ad investire o ad operare nei mercati finanziari. Non sono inoltre fornite o supportate da TradingView. Maggiori dettagli nelle Condizioni d'uso.
Declinazione di responsabilità
Le informazioni ed i contenuti pubblicati non costituiscono in alcun modo una sollecitazione ad investire o ad operare nei mercati finanziari. Non sono inoltre fornite o supportate da TradingView. Maggiori dettagli nelle Condizioni d'uso.