Gold Technical Strategy: Bullish Structure Intact, High-Cost-Effective Long Opportunities Available
On the daily chart, gold trades within an ascending channel with short-term moving averages in a bullish alignment. The 20-day moving average converges with the ascending trend line to form resonant support, reinforcing the upward bias.
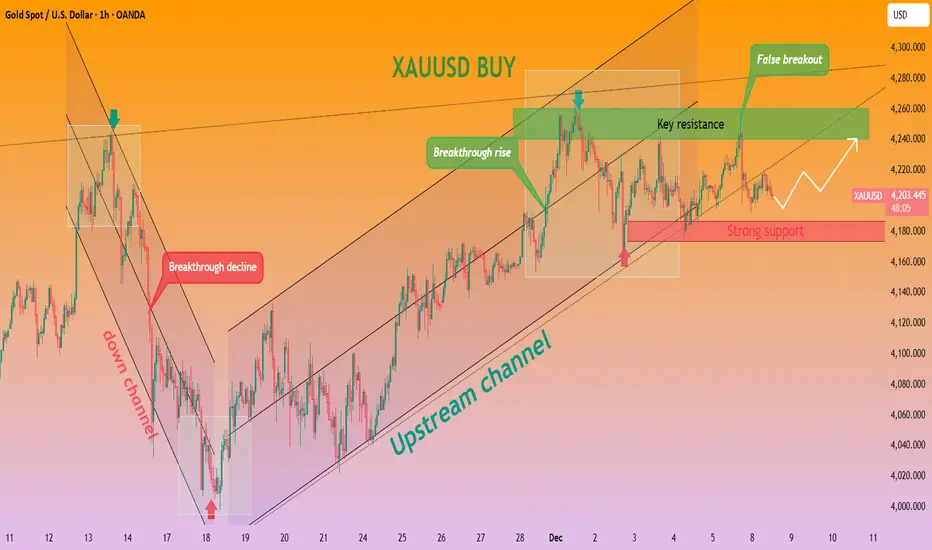
The 4-hour chart reveals a triangular consolidation pattern around the $4,200 level — a classic continuation signal of an uptrend, indicating accumulation of bullish momentum before the next move.
Clear Key Levels
Resistance Zones:
Short-term resistance: $4,230–$4,240 (upper edge of the triangle + previous high-volume trading zone).
Support Zones:
Immediate support: $4,180 (lower edge of the triangle + 5-day moving average).
Strong support: $4,170 (previous stabilization level, with solid buying interest).
Indicator Signals Confirm Bullish Bias
MACD: Remains above the zero line; although momentum has slightly contracted, there are no signs of a trend reversal, indicating sustained bullish dominance.
RSI: Trades in the neutral range, suggesting limited room for pullback and balanced market sentiment.
Current price levels offer favorable risk-reward for long positions, with clear support levels to limit downside and a consolidation pattern signaling potential upside momentum.
Gold trading strategy
buy:4190-4200
tp:4210-4220-4240
sl:4180
On the daily chart, gold trades within an ascending channel with short-term moving averages in a bullish alignment. The 20-day moving average converges with the ascending trend line to form resonant support, reinforcing the upward bias.
The 4-hour chart reveals a triangular consolidation pattern around the $4,200 level — a classic continuation signal of an uptrend, indicating accumulation of bullish momentum before the next move.
Clear Key Levels
Resistance Zones:
Short-term resistance: $4,230–$4,240 (upper edge of the triangle + previous high-volume trading zone).
Support Zones:
Immediate support: $4,180 (lower edge of the triangle + 5-day moving average).
Strong support: $4,170 (previous stabilization level, with solid buying interest).
Indicator Signals Confirm Bullish Bias
MACD: Remains above the zero line; although momentum has slightly contracted, there are no signs of a trend reversal, indicating sustained bullish dominance.
RSI: Trades in the neutral range, suggesting limited room for pullback and balanced market sentiment.
Current price levels offer favorable risk-reward for long positions, with clear support levels to limit downside and a consolidation pattern signaling potential upside momentum.
Gold trading strategy
buy:4190-4200
tp:4210-4220-4240
sl:4180
Trade attivo
Confirming the bullish signal💹💹💹Trading strategies and analysis: Gold, BTC, crude oil, foreign exchange, etc.
📶📶📶Free trading signals:t.me/+EbXVM-CStnFmNjBk
📶📶📶Free trading signals:t.me/+EbXVM-CStnFmNjBk
Declinazione di responsabilità
Le informazioni e le pubblicazioni non sono intese come, e non costituiscono, consulenza o raccomandazioni finanziarie, di investimento, di trading o di altro tipo fornite o approvate da TradingView. Per ulteriori informazioni, consultare i Termini di utilizzo.
💹💹💹Trading strategies and analysis: Gold, BTC, crude oil, foreign exchange, etc.
📶📶📶Free trading signals:t.me/+EbXVM-CStnFmNjBk
📶📶📶Free trading signals:t.me/+EbXVM-CStnFmNjBk
Declinazione di responsabilità
Le informazioni e le pubblicazioni non sono intese come, e non costituiscono, consulenza o raccomandazioni finanziarie, di investimento, di trading o di altro tipo fornite o approvate da TradingView. Per ulteriori informazioni, consultare i Termini di utilizzo.