✅ 4-Hour Chart Analysis: After reaching the previous high of 4379.52, gold has continued to fluctuate and pull back, currently trading near the middle Bollinger Band (around 4250–4260). The market is in a high-level consolidation phase, with support at 4160–4180 and resistance at 4275–4280. If the price fails to hold above the mid-band in the short term, it may continue to test support near the lower Bollinger Band (around 4150).
Moving Averages: MA5 and MA10 have formed a bearish crossover, indicating short-term weakness; MA20 (around 4256) is acting as a key resistance; meanwhile, MA60 and MA120 remain in an upward trend, suggesting that the medium- to long-term bullish structure is still intact.
Bollinger Bands: The upper band is near 4357, the middle around 4256, and the lower near 4155. The price is currently below the middle band; if it fails to reclaim the 4265–4280 area, there is still a risk of further downside movement.
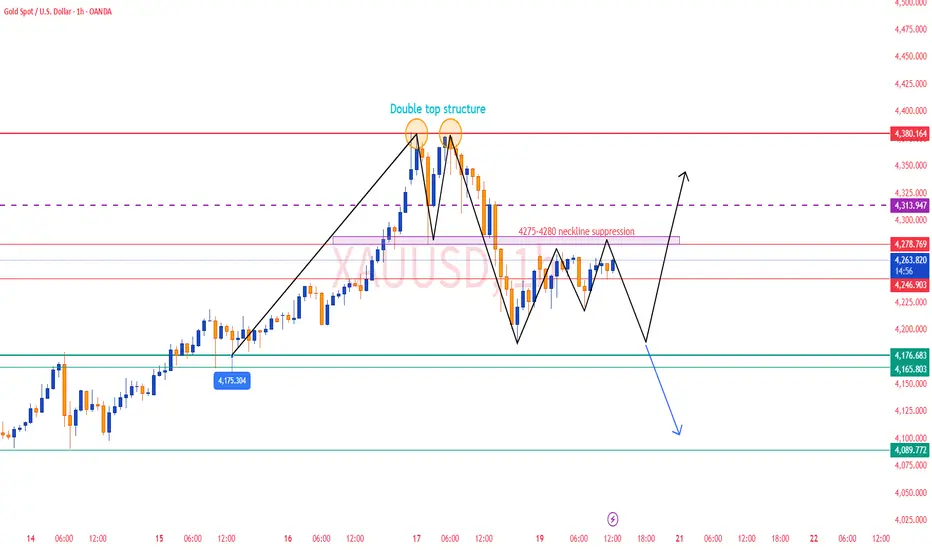
✅ 1-Hour Chart Analysis: After bottoming out around 4186.62, gold rebounded slightly and is now trading in a narrow range between 4250–4265.
The Bollinger Bands have narrowed, indicating reduced short-term volatility and a consolidation phase. The upper band is around 4279, the lower around 4213, and the price is oscillating near the middle band (around 4246), suggesting a lack of momentum for a breakout.
The 1-hour structure shows a sideways corrective pattern, with resistance remaining at 4275–4280 and short-term support at 4220–4210, reflecting a weak and range-bound bias.
🔴 Resistance Levels: 4275–4280 / 4300
🟢 Support Levels: 4180–4160 / 4090
✅ Trading Strategy Reference:
🔰 If the price rebounds to 4275–4280 and faces resistance, consider light short positions targeting 4180–4160, with a stop loss above 4300.
🔰 If the price dips to 4175–4180 and stabilizes, consider cautious long entries targeting 4250–4270, with a stop loss below 4160.
📊 Summary:
Gold’s short-term trend remains weak and range-bound. The 4-hour chart shows that bearish momentum is easing but not yet reversed, while the 1-hour chart indicates limited rebound strength.
Overall, 4280 remains the key resistance level — failure to break above it would likely extend the current correction. Meanwhile, the 4160–4180 support zone will determine whether the medium-term bullish structure can remain intact.
Moving Averages: MA5 and MA10 have formed a bearish crossover, indicating short-term weakness; MA20 (around 4256) is acting as a key resistance; meanwhile, MA60 and MA120 remain in an upward trend, suggesting that the medium- to long-term bullish structure is still intact.
Bollinger Bands: The upper band is near 4357, the middle around 4256, and the lower near 4155. The price is currently below the middle band; if it fails to reclaim the 4265–4280 area, there is still a risk of further downside movement.
✅ 1-Hour Chart Analysis: After bottoming out around 4186.62, gold rebounded slightly and is now trading in a narrow range between 4250–4265.
The Bollinger Bands have narrowed, indicating reduced short-term volatility and a consolidation phase. The upper band is around 4279, the lower around 4213, and the price is oscillating near the middle band (around 4246), suggesting a lack of momentum for a breakout.
The 1-hour structure shows a sideways corrective pattern, with resistance remaining at 4275–4280 and short-term support at 4220–4210, reflecting a weak and range-bound bias.
🔴 Resistance Levels: 4275–4280 / 4300
🟢 Support Levels: 4180–4160 / 4090
✅ Trading Strategy Reference:
🔰 If the price rebounds to 4275–4280 and faces resistance, consider light short positions targeting 4180–4160, with a stop loss above 4300.
🔰 If the price dips to 4175–4180 and stabilizes, consider cautious long entries targeting 4250–4270, with a stop loss below 4160.
📊 Summary:
Gold’s short-term trend remains weak and range-bound. The 4-hour chart shows that bearish momentum is easing but not yet reversed, while the 1-hour chart indicates limited rebound strength.
Overall, 4280 remains the key resistance level — failure to break above it would likely extend the current correction. Meanwhile, the 4160–4180 support zone will determine whether the medium-term bullish structure can remain intact.
Declinazione di responsabilità
Le informazioni ed i contenuti pubblicati non costituiscono in alcun modo una sollecitazione ad investire o ad operare nei mercati finanziari. Non sono inoltre fornite o supportate da TradingView. Maggiori dettagli nelle Condizioni d'uso.
Declinazione di responsabilità
Le informazioni ed i contenuti pubblicati non costituiscono in alcun modo una sollecitazione ad investire o ad operare nei mercati finanziari. Non sono inoltre fornite o supportate da TradingView. Maggiori dettagli nelle Condizioni d'uso.