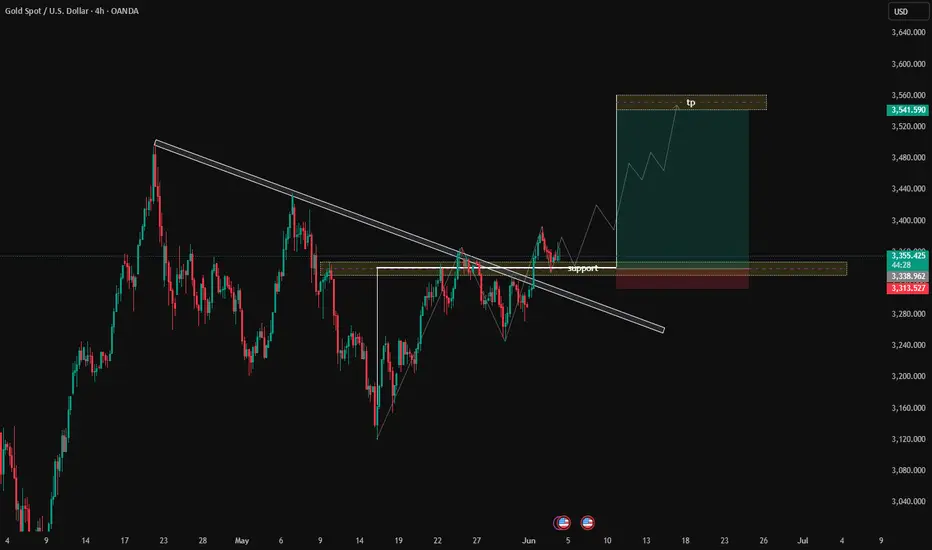
You’ve drawn a descending trendline from previous highs that’s been broken recently. This suggests a potential shift from a downtrend to an uptrend, indicating bullish momentum.
Support Zone Identified:
You marked a horizontal support zone around 3,320–3,340 USD (approx.). Price has retested this support zone after the breakout, showing it is now acting as a new support.
Bullish Continuation Plan:
From the support zone, you’ve drawn a potential bullish move with higher highs and higher lows, indicating a bullish market structure.
The projected move targets a take profit (TP) level around 3,560 USD, marked on the chart. This aligns with a previous swing high or a key resistance level.
Entry Strategy:
Price has already broken above the downtrend line and is consolidating around the new support zone. This suggests a buy trade opportunity from the support zone aiming for the TP level.
Risk Management:
Although you didn’t mark a stop-loss level explicitly, traders would normally place it below the support zone, maybe around 3,280 USD, to manage risk in case the breakout fails.
Summary in English:
You analyzed the 4-hour Gold chart and identified a descending trendline that has been broken, signaling a potential shift to an uptrend. The price has retested a key horizontal support zone around 3,320–3,340 USD. From this support zone, you expect the price to move upward in a series of higher highs and higher lows, eventually reaching the take profit zone around 3,560 USD. This analysis suggests a buy trade setup from the support zone with a target at 3,560 USD.
Simple Explanation:
A downtrend line was broken, showing bullish strength.
Price is now retesting the new support zone.
A bullish move is expected from this support zone, aiming for a higher target.
The trade idea is to buy from support and take profit at the higher target.
Declinazione di responsabilità
Le informazioni ed i contenuti pubblicati non costituiscono in alcun modo una sollecitazione ad investire o ad operare nei mercati finanziari. Non sono inoltre fornite o supportate da TradingView. Maggiori dettagli nelle Condizioni d'uso.
Declinazione di responsabilità
Le informazioni ed i contenuti pubblicati non costituiscono in alcun modo una sollecitazione ad investire o ad operare nei mercati finanziari. Non sono inoltre fornite o supportate da TradingView. Maggiori dettagli nelle Condizioni d'uso.