🟩 What Is a Symmetrical Triangle?
A symmetrical triangle pattern is a continuation pattern that typically forms when the market enters a phase of consolidation and price compression.
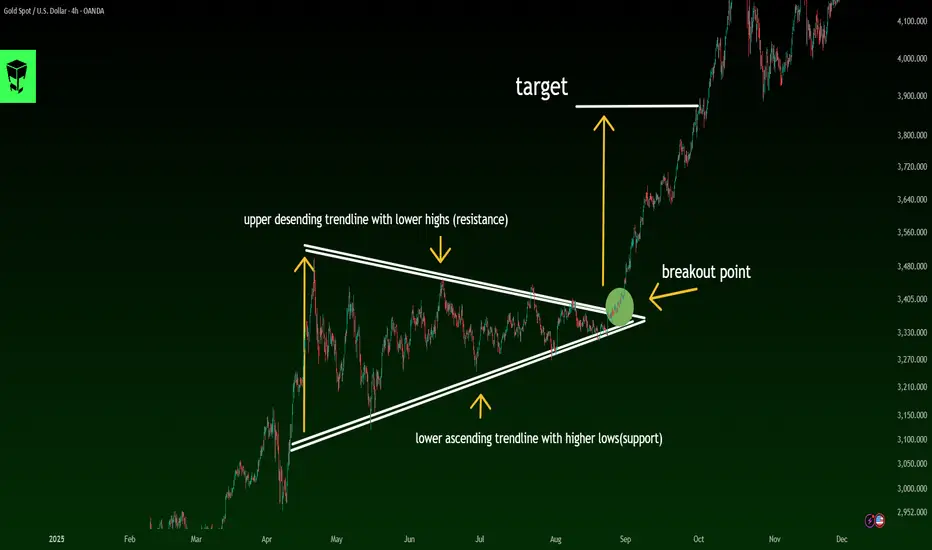
In this pattern, price moves between two converging trendlines—one descending and one ascending.
Upper trendline: Lower Highs
Lower trendline: Higher Lows
These two lines converge toward each other, forming a balanced, center-aligned triangle.
🟨 Key Characteristics of a Symmetrical Triangle
✔️ Two converging trendlines (one sloping down, one sloping up)
✔️ Gradual decrease in trading volume
✔️ Price moves toward the apex of the triangle
✔️ Breakouts usually follow the prior trend
✔️ It is primarily a continuation pattern, though occasional reversals can happen
🟦 How to Identify a Symmetrical Triangle
To confirm a valid symmetrical triangle, check the following:
🔹 1. At least two touches on resistance and two on support
You must see lower highs and higher lows.
🔹 2. Both trendlines must slope inward
Unlike ascending or descending triangles, both lines are angled.
🔹 3. Price must contract toward the apex
Smaller swings = market compression.
🔹 4. Volume should gradually decline
Until the breakout occurs.
🟧 Professional Entry Strategies
📌 Method 1: Entering After the Breakout (Conservative Entry)
Wait for a candle to close outside the triangle
Volume should increase as confirmation
Stop-loss below the last swing or below the trendline
📌 Method 2: Entering After a Pullback (Low-Risk Entry)
Wait for a retest of the broken trendline
Use candlestick triggers (Pin Bar, Engulfing, Break & Retest)
Much smaller stop-loss + a better risk-to-reward ratio
📌 Method 3: Volume + Breakout + Positioning
For advanced traders, Volume Spread Analysis (VSA) is the strongest confirmation tool for breakouts.
🔶 Setting Take-Profit Targets
Standard Method:
📐 Target = Height of the triangle base
(measured from the widest part of the pattern)
Professional methods:
✔️ Target 1: Market Structure
Based on supply/demand zones
✔️ Target 2: Fibonacci Extensions
1.618 is often the most reliable target
✔️ Target 3: Multi-Timeframe Alignment
Check breakout levels in higher timeframes for added confidence
🔶 Fake Breakouts in Symmetrical Triangles
Fake breakouts are extremely common in this pattern.
Signs of a fake breakout:
❌ Low volume
❌ Long-wick candles
❌ Quick rejection back into the triangle
❌ Breakout occurs too close to the apex
❌ Lack of momentum
Fake breakouts often lead to a strong move in the opposite direction.
🔶 Pattern Behavior in Different Market Conditions
🟢 In an uptrend:
80% of the time it breaks upward → continuation
🔴 In a downtrend:
About 65% of the time it breaks downward → continuation
⚪️ In a ranging market:
Direction of breakout is uncertain → extra caution required
🔶 Common Mistakes Traders Make
🚫 Entering before the breakout
🚫 Confusing the pattern with ascending/descending triangles
🚫 Trusting breakouts without volume confirmation
🚫 Setting stops too close
🚫 Ignoring market psychology and momentum
🔷 Final Professional Summary
A symmetrical triangle indicates:
The market is in a compression phase
Lower Highs + Higher Lows
Price is preparing for a strong explosive move
Breakouts usually follow the prior trend
Valid breakouts require volume + candle close outside
Targets follow the triangle height or Fibonacci extensions
Fake breakouts are common → caution is essential
A symmetrical triangle pattern is a continuation pattern that typically forms when the market enters a phase of consolidation and price compression.
In this pattern, price moves between two converging trendlines—one descending and one ascending.
Upper trendline: Lower Highs
Lower trendline: Higher Lows
These two lines converge toward each other, forming a balanced, center-aligned triangle.
🟨 Key Characteristics of a Symmetrical Triangle
✔️ Two converging trendlines (one sloping down, one sloping up)
✔️ Gradual decrease in trading volume
✔️ Price moves toward the apex of the triangle
✔️ Breakouts usually follow the prior trend
✔️ It is primarily a continuation pattern, though occasional reversals can happen
🟦 How to Identify a Symmetrical Triangle
To confirm a valid symmetrical triangle, check the following:
🔹 1. At least two touches on resistance and two on support
You must see lower highs and higher lows.
🔹 2. Both trendlines must slope inward
Unlike ascending or descending triangles, both lines are angled.
🔹 3. Price must contract toward the apex
Smaller swings = market compression.
🔹 4. Volume should gradually decline
Until the breakout occurs.
🟧 Professional Entry Strategies
📌 Method 1: Entering After the Breakout (Conservative Entry)
Wait for a candle to close outside the triangle
Volume should increase as confirmation
Stop-loss below the last swing or below the trendline
📌 Method 2: Entering After a Pullback (Low-Risk Entry)
Wait for a retest of the broken trendline
Use candlestick triggers (Pin Bar, Engulfing, Break & Retest)
Much smaller stop-loss + a better risk-to-reward ratio
📌 Method 3: Volume + Breakout + Positioning
For advanced traders, Volume Spread Analysis (VSA) is the strongest confirmation tool for breakouts.
🔶 Setting Take-Profit Targets
Standard Method:
📐 Target = Height of the triangle base
(measured from the widest part of the pattern)
Professional methods:
✔️ Target 1: Market Structure
Based on supply/demand zones
✔️ Target 2: Fibonacci Extensions
1.618 is often the most reliable target
✔️ Target 3: Multi-Timeframe Alignment
Check breakout levels in higher timeframes for added confidence
🔶 Fake Breakouts in Symmetrical Triangles
Fake breakouts are extremely common in this pattern.
Signs of a fake breakout:
❌ Low volume
❌ Long-wick candles
❌ Quick rejection back into the triangle
❌ Breakout occurs too close to the apex
❌ Lack of momentum
Fake breakouts often lead to a strong move in the opposite direction.
🔶 Pattern Behavior in Different Market Conditions
🟢 In an uptrend:
80% of the time it breaks upward → continuation
🔴 In a downtrend:
About 65% of the time it breaks downward → continuation
⚪️ In a ranging market:
Direction of breakout is uncertain → extra caution required
🔶 Common Mistakes Traders Make
🚫 Entering before the breakout
🚫 Confusing the pattern with ascending/descending triangles
🚫 Trusting breakouts without volume confirmation
🚫 Setting stops too close
🚫 Ignoring market psychology and momentum
🔷 Final Professional Summary
A symmetrical triangle indicates:
The market is in a compression phase
Lower Highs + Higher Lows
Price is preparing for a strong explosive move
Breakouts usually follow the prior trend
Valid breakouts require volume + candle close outside
Targets follow the triangle height or Fibonacci extensions
Fake breakouts are common → caution is essential
Declinazione di responsabilità
Le informazioni e le pubblicazioni non sono intese come, e non costituiscono, consulenza o raccomandazioni finanziarie, di investimento, di trading o di altro tipo fornite o approvate da TradingView. Per ulteriori informazioni, consultare i Termini di utilizzo.
Declinazione di responsabilità
Le informazioni e le pubblicazioni non sono intese come, e non costituiscono, consulenza o raccomandazioni finanziarie, di investimento, di trading o di altro tipo fornite o approvate da TradingView. Per ulteriori informazioni, consultare i Termini di utilizzo.