1. Fibonacci Levels
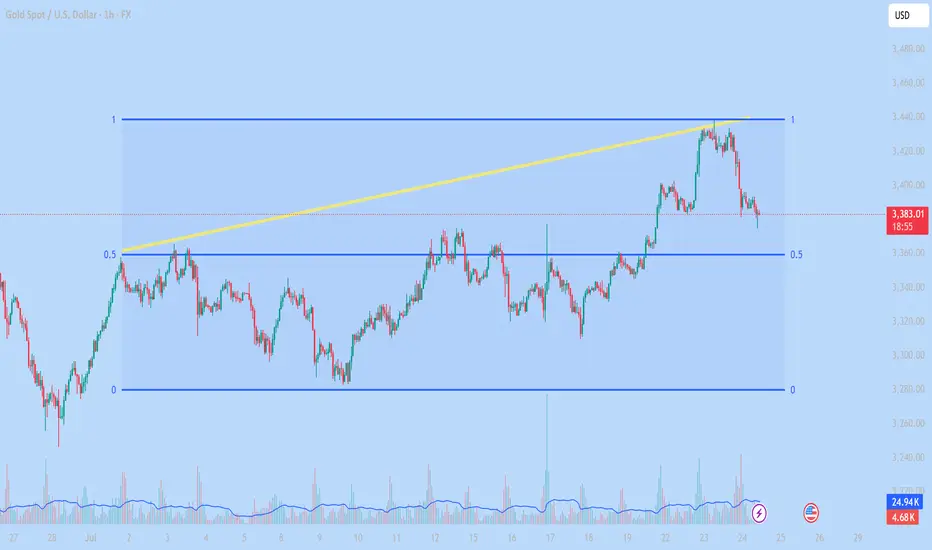
The chart uses a Fibonacci range from 0 to 1, likely drawn from a significant low to a recent high.
The 0.5 Fibonacci level (around $3,360) is acting as a major support zone and price is currently testing this level.
2. Short-term Trend
Price broke above the previous high and formed a new high near $3,440, but then reversed sharply.
Now it’s pulling back toward a key support zone between $3,360 – $3,380.
3. Volume Analysis
Volume spiked at the top near $3,440, suggesting strong selling pressure or profit-taking.
Volume slightly increases again as price reaches support → possible buying interest at the current level.
4. Trendline (Yellow Line)
The ascending yellow trendline has been broken to the downside, signaling a break in short-term bullish momentum.
Possible Scenarios
Scenario 1 – Bullish Rebound from Support:
If price holds above the $3,360 zone and forms bullish candles, we could see a recovery toward $3,400–$3,420.
That area can act as a short-term profit-taking zone.
Scenario 2 – Bearish Breakdown Below 0.5 Level:
If price breaks below the $3,360 support with strong bearish candles, it may drop further toward the Fibonacci 0 level (~$3,280).
Conclusion
Gold is at a critical decision point. Holding the $3,360 support could lead to a bullish bounce. Breaking it would likely confirm a short-term downtrend. Monitor the next few candles closely for confirmation.
Would you like a trade plan or entry/exit suggestion based on this chart?
🪙 JOIN OUR FREE TELEGRAM GROUP 🪙
t.me/dnaprofits
Join the community group to get support and share knowledge!
️🥇 Exchange and learn market knowledge
️🥇 Support free trading signals
t.me/dnaprofits
Join the community group to get support and share knowledge!
️🥇 Exchange and learn market knowledge
️🥇 Support free trading signals
Pubblicazioni correlate
Declinazione di responsabilità
Le informazioni ed i contenuti pubblicati non costituiscono in alcun modo una sollecitazione ad investire o ad operare nei mercati finanziari. Non sono inoltre fornite o supportate da TradingView. Maggiori dettagli nelle Condizioni d'uso.