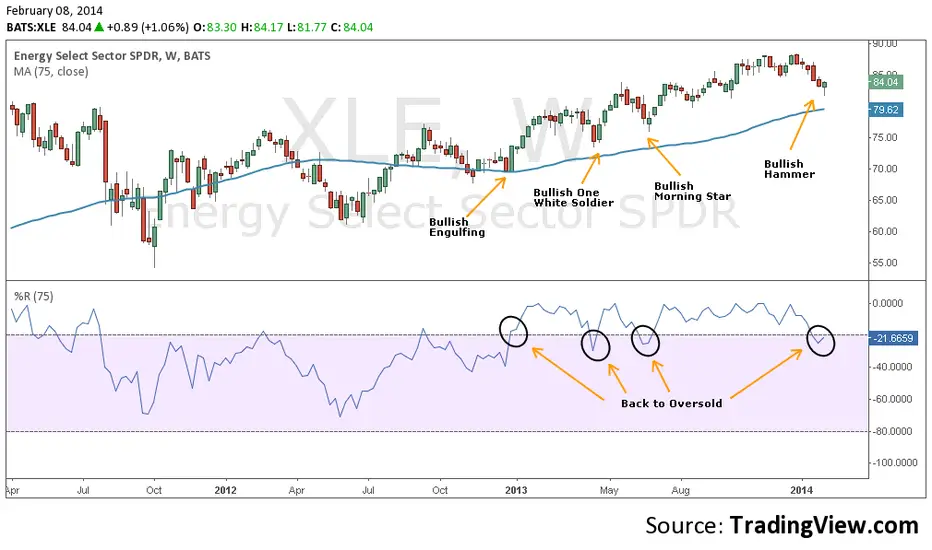
XLE's streak of five consecutive losing weeks came to an end this week with a .79% gain and an equally important "hammer". The hammer candle in the attached chart is a potential bullish reversal candle that requires confirmation. As a coincident indicator we use the "overbought/oversold" Williams %R indicator. An overbought condition is bullish for the ETF and bullish conditions can remain so for extended periods of time. Prior reversals have coincided with a small dip of the Williams %R below overbought and then a sharp reversal back to overbought. If next week is positive for XLE we can consider this reversal confirmed and higher prices ahead.
For more analysis, signals, education, and more sign up for Forex Forecast. It's free.
positionforex.my.canva.site/bio-link-site
positionforex.my.canva.site/bio-link-site
Declinazione di responsabilità
Le informazioni e le pubblicazioni non sono intese come, e non costituiscono, consulenza o raccomandazioni finanziarie, di investimento, di trading o di altro tipo fornite o approvate da TradingView. Per ulteriori informazioni, consultare i Termini di utilizzo.