📉
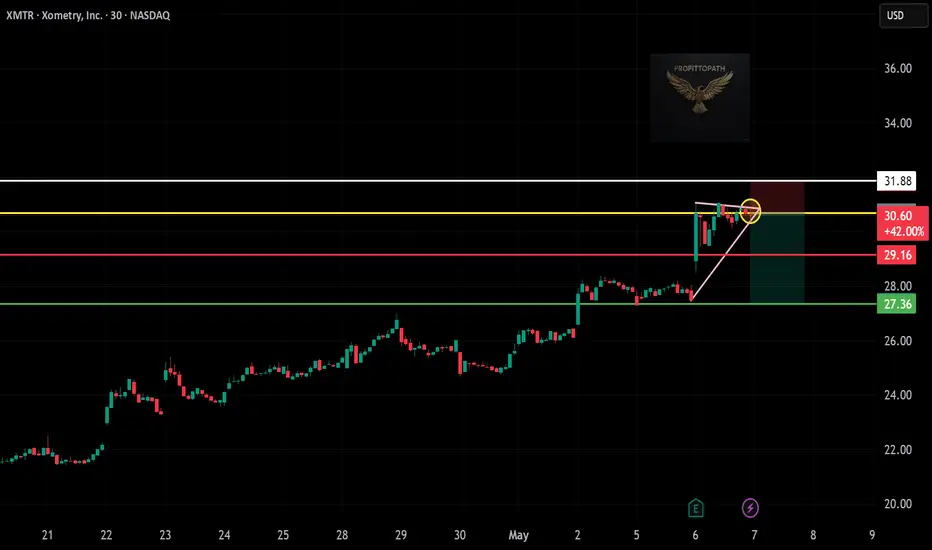
🔹 Asset: Xometry, Inc. (NASDAQ: XMTR)
🔹 Timeframe: 30-Minute Chart
🔹 Setup Type: Rising Wedge Breakdown
📌 Trade Plan (Short Position)
✅ Entry: Below $30.60 (Breakdown confirmation zone)
✅ Stop-Loss (SL): Above $31.88 (Wedge breakout invalidation)
🎯 Take Profit Targets:
📌 TP1: $29.16 – First minor support
📌 TP2: $27.36 – Key demand zone / breakdown target
📊 Risk-Reward Ratio Calculation
📉 Risk: $31.88 - $30.60 = $1.28
📈 Reward to TP1: $30.60 - $29.16 = $1.44 (1:1.1 R/R)
📈 Reward to TP2: $30.60 - $27.36 = $3.24 (1:2.5 R/R ✅)
🔍 Technical Highlights
📌 Rising wedge pattern broke down at top resistance
📌 Price rejected yellow zone (prior resistance)
📌 Bearish candle forming after retest
📌 Potential momentum shift if volume confirms
📉 Execution & Risk Strategy
📊 Wait for breakdown confirmation below $30.60
📉 Use trailing stop after TP1 hit
💰 Book partial profits at TP1, let rest run toward TP2
🚨 Invalidation Warning
❌ If price breaks back above $31.88 — exit
❌ Avoid early entry without solid bearish volume
🚀 Final Take
✔ Bearish setup forming with clean levels
✔ Solid 1:2.5 R:R potential
✔ Trade with discipline — let price confirm
Declinazione di responsabilità
Le informazioni ed i contenuti pubblicati non costituiscono in alcun modo una sollecitazione ad investire o ad operare nei mercati finanziari. Non sono inoltre fornite o supportate da TradingView. Maggiori dettagli nelle Condizioni d'uso.
Declinazione di responsabilità
Le informazioni ed i contenuti pubblicati non costituiscono in alcun modo una sollecitazione ad investire o ad operare nei mercati finanziari. Non sono inoltre fornite o supportate da TradingView. Maggiori dettagli nelle Condizioni d'uso.