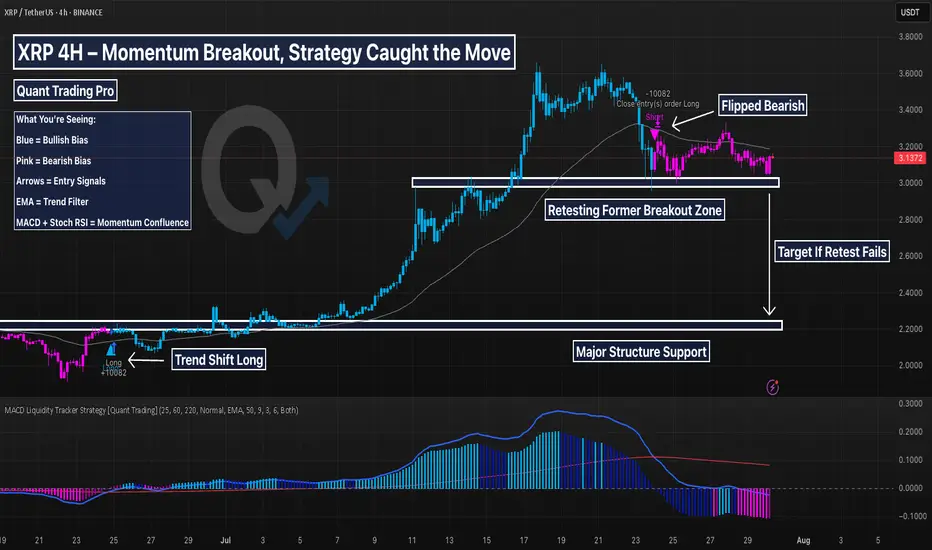
This XRP chart is a textbook example of the MACD Liquidity Tracker Strategy in action. After flipping bullish in late June, the system triggered a clean long and stayed in the move for over 100% before flipping bearish near the local top.
The system didn’t chase or guess — it followed clear logic:
MACD momentum confirmed
Trend aligned with EMA
State flipped blue → long triggered
Exit near top when momentum shifted
Now, XRP is in a bearish state, retesting its prior breakout zone. The MACD histogram remains below zero, and price is below the trend filter — indicating caution. But this is exactly where strategy traders prep for reversals or continuation.
🔍 Highlights:
Clean +100% trend catch
Momentum shift = smooth exit
Currently respecting support = decision zone
Still in “wait” mode — no guessing
This system shines when volatility expands. Perfect for trend traders who want clarity and control — and ideal to backtest.
Explore 5,000 Strategies at quanttradingpro.com
Search for the most profitable, lowest risk by symbol!
Search by indicators like Supertrend, Ichimoku, macd.
Join our discord discord.gg/2systG9frc
We provide education & tools.
Search for the most profitable, lowest risk by symbol!
Search by indicators like Supertrend, Ichimoku, macd.
Join our discord discord.gg/2systG9frc
We provide education & tools.
Declinazione di responsabilità
Le informazioni e le pubblicazioni non sono intese come, e non costituiscono, consulenza o raccomandazioni finanziarie, di investimento, di trading o di altro tipo fornite o approvate da TradingView. Per ulteriori informazioni, consultare i Termini di utilizzo.