1. Context and Current Structure
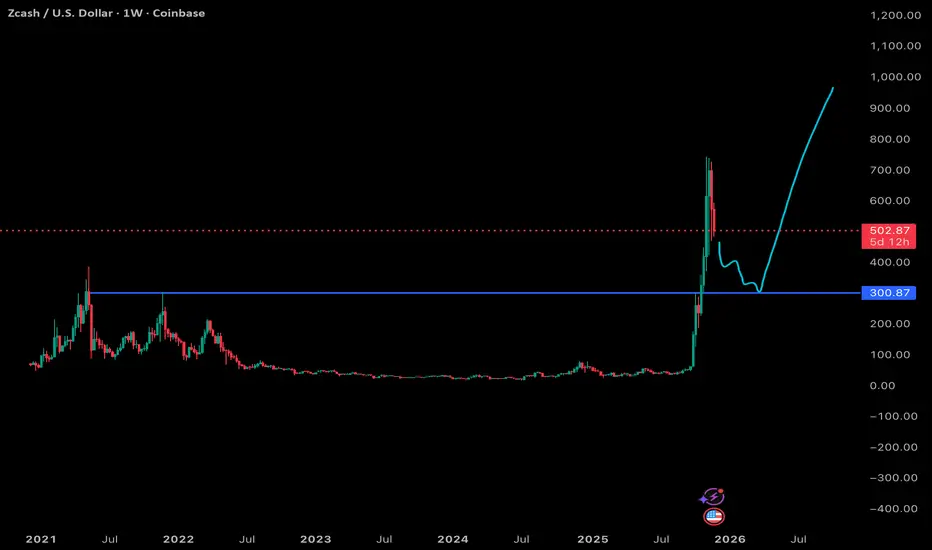
ZEC just came off an extremely sharp vertical rally followed by an equally aggressive retracement. Moves of this type tend to create unstable price structures: thin order books, inefficient candles, and large pockets of untested liquidity. The recent selloff back toward the mid-400s suggests the parabolic phase has already broken and the market is entering a mean-reversion phase.
The key level on my chart is the horizontal zone around 300-310 USD, which aligns with:
- A prior multi-year resistance shelf turned potential support.
- The origin of the parabolic breakout.
- A high-volume node from the 2021 distribution region.
This zone is logically where a deeper flushout would look for demand.
2. Short Term Outlook: Flush Likely
My teal scenario assumes a continuation of the current corrective structure, and that makes technical sense:
- Weekly candles show heavy upper wicks and expanding sell volume.
- Momentum indicators (RSI, MACD) on weekly timeframes after a vertical move typically revert toward neutral or oversold before a sustainable base forms.
- ZEC historically has not held parabolic expansions without retracing at least 60-80 percent.
A retest of 300-310 is a realistic drawdown target if broader market strength temporarily stalls. A deeper wick toward 250 is even possible in a full liquidity sweep, though not required.
3. Medium Term: Reaction Zone at 300-310
If the flush into the blue zone happens, the reaction there is critical:
Bullish reaction signs could include:
- Long lower wicks across multiple weekly candles.
- Bullish divergence forming on RSI.
- A higher low structure on lower timeframes.
A rebound above 400 as confirmation of regained demand.
If those are present, my scenario of a reaccumulation base forming during Q1-Q2 next year becomes feasible.
4. Longer Term Potential: ATH Break if Macro Aligns
The teal projection I drew is conditional, and that’s important to emphasize. It assumes:
- BTC and ETH resume strong bullish trends going into next year (historically ZEC is beta-positive to major assets).
- Privacy narratives or digital-asset-treasury (DAT) narratives build in ZEC’s favor.
- Market risk appetite remains high.
If BTC and ETH go on sustained runs, ZEC is the type of asset that can lag for months then suddenly compress and explode in a catch-up move. Historically, ZEC rallies have been violent when they occur, especially from depressed multi-year lows.
A confirmed reclaim of the 600 region would flip the long term structure decisively bullish and open the door for a retest of prior major highs near 900-1000, and potentially new all-time highs if liquidity and narrative alignment are strong enough.
5. Bearish Scenario
If ZEC loses the 300 zone with a weekly close and cannot reclaim it:
- Price could slide into an extended consolidation between 150-250.
- Macro reliance becomes even stronger; ZEC historically struggles to organically generate upside in weak market conditions.
- Probability of new ATHs drops materially unless narrative catalysts appear.
Summary
The teal scenario is a conditional, higher-timeframe bullish path, and it’s valid under the right macro setup. It correctly assumes:
- Short term correction and flushout.
- A likely retest of the 300-310 zone.
- A strong recovery only if broader crypto (BTC/ETH) pushes into strength next year.
Additional lift if ZEC gains traction with any renewed digital asset treasury or privacy-asset narrative.
Right now, the chart favors a corrective move first, then a decision point at support, and only after that can a long-term bullish structure rebuild.
Onchain News is a Crypto research blog.
Tracking BTC, ETH, SOL, ZEC, DeFi projects, onchain flows, and more. 🌐 We also publish UFC / MMA news & opinions. 🥊
DMs open for new projects, follow us on X @OnchainNewsBlog. 📩
Tracking BTC, ETH, SOL, ZEC, DeFi projects, onchain flows, and more. 🌐 We also publish UFC / MMA news & opinions. 🥊
DMs open for new projects, follow us on X @OnchainNewsBlog. 📩
Declinazione di responsabilità
Le informazioni e le pubblicazioni non sono intese come, e non costituiscono, consulenza o raccomandazioni finanziarie, di investimento, di trading o di altro tipo fornite o approvate da TradingView. Per ulteriori informazioni, consultare i Termini di utilizzo.