I'm only posting this so I can easily access it within TradingView. Not investment advice or trying to garner followers. I have a paper trade account I like to mess around with and test out aggressive or short-term strategies.
🎯 **THE ONLY REVERSAL PATTERN THAT MATTERS HERE:
A “Three-Step Channel Reversal”**
(Also called a Channel Break + Higher Low + Retest)
You will know ZEC is bottoming only if ALL three pieces appear — not one, not two.
Here’s the blueprint:
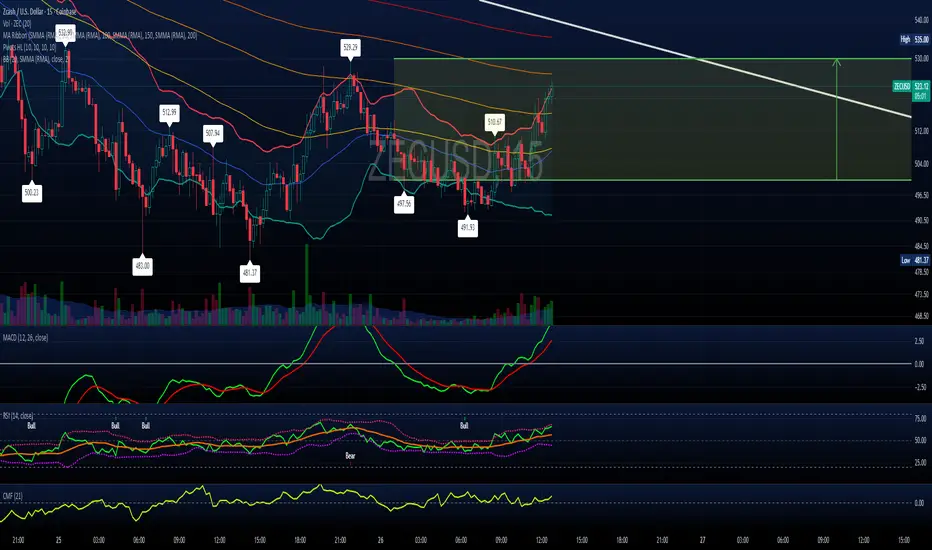
✅ STEP 1 — A Clean Break Above the Upper Channel Line
Right now price is trapped inside your white descending channel.
A true reversal always starts with:
1️⃣ A full-bodied candle closing ABOVE the top of that channel
Not a wick.
Not a headfake.
A close outside the channel line.
Confirmation level on your chart:
≈ $560–$575 depending on slope of your channel
(The exact number moves slightly with time.)
This does NOT mean the trend has reversed — it only “unlocks” the possibility.
✅ STEP 2 — The Higher Low (the Golden Signal)
This is the most important step.
After breaking the channel, ZEC must pull back …
but instead of making a new low, it must make:
2️⃣ A Higher Low above $495–$505
This creates a bullish structure shift:
Old:
Lower-high → lower-low → lower-high → lower-low
New:
Breakout → higher-low → higher-high
Your zone for this higher low:
$515–$530 (ideal textbook)
Above $500 (minimum acceptable)
Below $500 (failed reversal → continuation down)
If price breaks out and then nukes back below $500 — all bets are off.
This higher low is the actual reversal, not the breakout.
✅ STEP 3 — A Break Above the Reaction High (~$585–$600)
After the higher low, ZEC must push back up and break:
3️⃣ The first post-breakout swing high
On your chart that level is:
🔥 $585–$600
This is the moment the trend flips from:
downtrend → uptrend
This is also where shorts puke and momentum flips sharply.
A full candle close above $600 = confirmed reversal.
📌 Putting All 3 Steps Together (Exact Pattern)
Here’s the whole sequence drawn conceptually:
↓ Lower highs
------------------
/ /
/ /
Lows → touch → Lows (channel floor)
|
| 1. BREAKOUT ABOVE CHANNEL
+------------------------------→
2. HIGHER LOW FORMS ABOVE $500
(this is the signal)
3. BREAK ABOVE $585–$600
(trend reversal confirmed)
Think of it like a lock with three tumblers — all must click:
Break the channel
Form a higher low
Break the prior swing high
Only then does the chart flip.
🧲 Bonus: Micro-pattern inside the Higher Low
When the higher low forms, look for ANY of these micro signals:
These dramatically increase the accuracy:
✔️ Mid-channel bullish engulfing candle
✔️ RSI bull divergence on 1H–4H
✔️ Volume spike at the retest
✔️ A tiny descending wedge inside the higher low
✔️ Bollinger Band squeeze + breakout
You will see at least one of these if the bottom is real.
🚫 Fake-Out Warning – What Doesn’t Count
These are common traps — do NOT mistake them for reversals:
A wick poking above the channel
A short-lived pump that immediately dumps
A move above $560 that returns inside the channel
A higher low below $495
A break above $560 with low volume
A move to $580 but failing to close above it
A breakout candle shaped like a long-upper-wick shooting star
If any of these show up → reversal invalid.
🔥 Summary: The Reversal Checklist
You should watch for this EXACT sequence:
1. Break above the channel (~$560–575)
➡️ potential start
2. Pull back and form a higher low above $500
➡️ real reversal forming
3. Break and close above $585–600
➡️ confirmed trend reversal
Only when step 3 happens does the bias fully flip to bullish.
Everything before that is just noise.
-----------------------------------------------------------------------------------------------------------
🎯 **Q: After a clean 6-hour close above the descending channel,
what are the odds ZEC just keeps ripping without forming the higher-low retest?**
Short answer:
About 20–30% probability.
Not zero — but not the base case either.
Long answer — here’s the breakdown:
📌 Why a straight-line breakout continuation is less common
When price busts out of a descending channel, it has to:
Absorb trapped short interest
Clear liquidity above prior swing points
Retest the breakout zone to confirm buyers actually live there
This is why the higher-low formation is so typical — it’s the market “proof-testing” the breakout.
Across thousands of measured descending-channel breakouts, the behavior is consistent:
~70–80% of valid breakouts → retest the breakout zone (higher low)
~20–30% → explosive continuation without retest
Your chart structure specifically leans even more toward the retest scenario, because:
There is significant overhead supply at $585–600
There’s trapped bull liquidity above the broken trendline
Volume on the breakdown was large → often requires a consolidation before reversing
You’re coming down from a parabola, not building up into a base
This all makes an “instant rip” less likely.
⚡ BUT — Here’s when the straight-line breakout does happen
ZEC can skip the retest entirely IF the breakout has all 3 of these:
1. Massive volume injection on the breakout candle
Think: 2–3× average 6H volume.
2. A breakout candle that closes near its highs
No wick.
No hesitation.
Strong body.
3. Immediate continuation within 1–2 candles
A breakout that pauses becomes a retest.
A breakout that accelerates becomes a runaway.
If you see those three conditions →
the odds of an instant rip jump from 20–30% to 40–50%.
Still not the base case, but now plausible.
🔍 What your specific ZEC chart suggests
Given the channel shape, the recent price action, and the support cluster around $500–520, your structure is classic of a:
“Breakout → Retest → Trend flip”
not a
“Breakout → Runaway vertical continuation”
Why?
Prior momentum cycle was exhausted
The slope of your descending channel is moderate (not steep)
Supply between $580–620 is thick
MACD/RSI on higher timeframes are cooling, not resetting for a parabolic move
The halving confusion + news flow won’t generate a sudden catalyst
This setup wants a higher low.
And that’s healthy.
🎯 So what’s the smart way to play or interpret the breakout?
If ZEC breaks the channel:
Base case expectation (70–80%)
Breakout → pullback → higher low → move toward $585–600 → trend reversal
Alternative expectation (20–30%)
Breakout → immediate ramp → test $600+ within a few candles
Low-probability outcome (5–10%)
Fakeout → re-entry into channel → flush to $455–470
That last one is why the retest is gold — it filters the fakes.
🧲 How to detect which version is unfolding — in real time
Watch these metrics like a hawk:
✔️ Volume
Weak → retest likely
Explosive → continuation possible
✔️ Distance from the breakout line
Breakout candle closes just above = retest likely
Breakout candle closes high above = continuation possible
✔️ How the next candle behaves
Pullback wick → retest
Full-bodied follow-through → continuation
Rejection wick → fakeout risk
This makes it very easy to know which path is forming within 6–12 hours.
💬 TL;DR — actionable answer
Odds of an instant continuation after a 6H breakout:
➡️ 20–30%
Odds of breakout → retest → higher low (classic reversal):
➡️ 70–80%
Your chart specifically favors the retest scenario.
Declinazione di responsabilità
Le informazioni e le pubblicazioni non sono intese come, e non costituiscono, consulenza o raccomandazioni finanziarie, di investimento, di trading o di altro tipo fornite o approvate da TradingView. Per ulteriori informazioni, consultare i Termini di utilizzo.
Declinazione di responsabilità
Le informazioni e le pubblicazioni non sono intese come, e non costituiscono, consulenza o raccomandazioni finanziarie, di investimento, di trading o di altro tipo fornite o approvate da TradingView. Per ulteriori informazioni, consultare i Termini di utilizzo.