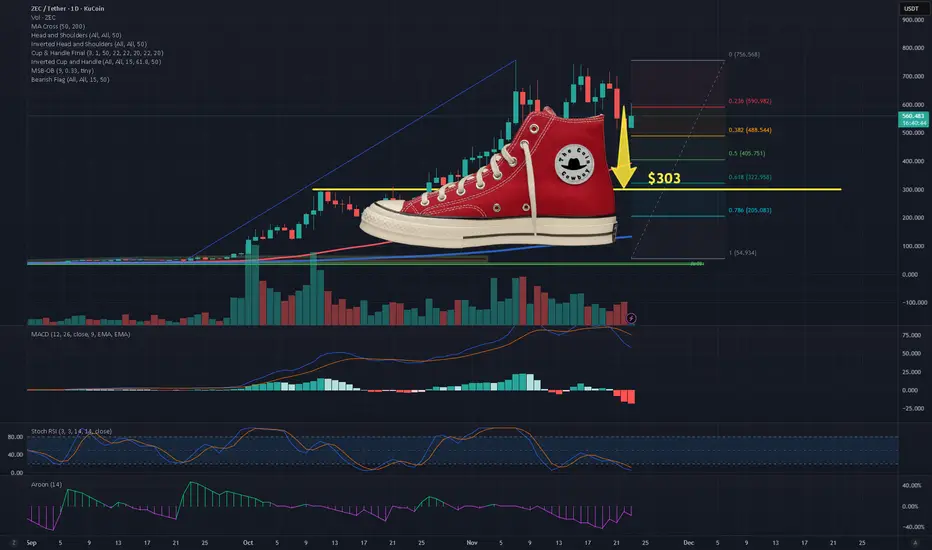
My 7 reasons why ZEC is about to drop to the heel of the shoe.
1. Price Rejected Hard at the 0.236 Fibonacci Level
In most parabolic assets, 0.236 → 0.382 → 0.618 is the natural sequence when momentum dies.
ZEC already hit 0.382 around $476, and bounced weakly. Next logical magnet is 0.618 = $306.
2. The $548 Horizontal Level Was Lost (Key Breakdown)
$548 was:
Losing this floor confirms that buyers couldn’t defend the mid-range.
When a mid-range collapses, price usually moves to the next major liquidity pool, which here is:
👉 0.618 Fib at $306
👉 200MA cluster between $380–$400
3. Volume Profile Shows a Gap Below $480
This means once $480 breaks convincingly, price can accelerate rapidly toward:
📌 $380–$400
📌 $305–$330
4. MACD Bearish Cross With Increasing Bearish Momentum
MACD shows:
When MACD crosses down after a blow-off top, the retrace is usually 50–70%.
That places ZEC’s ideal retrace zone between:
5. Stochastic RSI Bottoming? Not Yet — Could Stay Oversold in a Downtrend
6. Aroon Indicator Shows Strong Downtrend Confirmation
7. Market Structure: Lower Highs + Breakdown of Rising Structure
The chart clearly shows:
Once distribution completes, assets typically retrace to:
📌 0.618
or
📌 the base of the breakout structure
The base of ZEC’s breakout...
→ $300–$350 area
1. Price Rejected Hard at the 0.236 Fibonacci Level
- The recent top at $752
- Strong rejection at $582 (0.236 level)
- Price tried to reclaim 0.236 multiple times and failed, which signals:
- The bullish trend has lost strength and a deeper retracement is likely.
In most parabolic assets, 0.236 → 0.382 → 0.618 is the natural sequence when momentum dies.
ZEC already hit 0.382 around $476, and bounced weakly. Next logical magnet is 0.618 = $306.
2. The $548 Horizontal Level Was Lost (Key Breakdown)
$548 was:
- former support
- former demand zone
- heavy volume node (visible on histogram)
- Price closed below it, which makes it broken support → new resistance
Losing this floor confirms that buyers couldn’t defend the mid-range.
When a mid-range collapses, price usually moves to the next major liquidity pool, which here is:
👉 0.618 Fib at $306
👉 200MA cluster between $380–$400
3. Volume Profile Shows a Gap Below $480
- Volume bars reveal high trading activity between $540–$620
- A void / low-volume area between $470 → $380
- Markets tend to fill low-volume gaps quickly because:
- There is little historical demand to slow price down
This means once $480 breaks convincingly, price can accelerate rapidly toward:
📌 $380–$400
📌 $305–$330
4. MACD Bearish Cross With Increasing Bearish Momentum
MACD shows:
- MACD line crossing below signal line
- Histogram printing deeper red bars
- MACD approaching the zero line
- A MACD cross this high up (after a parabolic run) is dangerous
When MACD crosses down after a blow-off top, the retrace is usually 50–70%.
That places ZEC’s ideal retrace zone between:
- 0.5 Fib → $391
- 0.618 Fib → $306
- Again, pointing toward the $300 range
5. Stochastic RSI Bottoming? Not Yet — Could Stay Oversold in a Downtrend
- Stoch RSI is oversold, but this is misleading because:
- In downtrends, Stoch RSI can remain pinned down while price continues falling.
- This happens during macro trend reversals.
- Oversold Stoch does not mean reversal—it often means continuation.
6. Aroon Indicator Shows Strong Downtrend Confirmation
- Aroon indicator is down (purple) is dominating
- Aroon Up (green) is completely suppressed
- This means trend strength = bearish
- Aroon tends to be a leading indicator, so with this reading:
- Trend is already confirmed bearish. More downside is expected.
7. Market Structure: Lower Highs + Breakdown of Rising Structure
The chart clearly shows:
- A lower high after the top (not a good sign)
- Breakdown of the parabolic rising wedge
- Failed retest zone around $600
- Candle spreads widening on down moves (increasing sell pressure)
- All of that is consistent with a distribution pattern after a massive run
Once distribution completes, assets typically retrace to:
📌 0.618
or
📌 the base of the breakout structure
The base of ZEC’s breakout...
→ $300–$350 area
Declinazione di responsabilità
Le informazioni e le pubblicazioni non sono intese come, e non costituiscono, consulenza o raccomandazioni finanziarie, di investimento, di trading o di altro tipo fornite o approvate da TradingView. Per ulteriori informazioni, consultare i Termini di utilizzo.
Declinazione di responsabilità
Le informazioni e le pubblicazioni non sono intese come, e non costituiscono, consulenza o raccomandazioni finanziarie, di investimento, di trading o di altro tipo fornite o approvate da TradingView. Per ulteriori informazioni, consultare i Termini di utilizzo.