🔎 Pattern Analysis
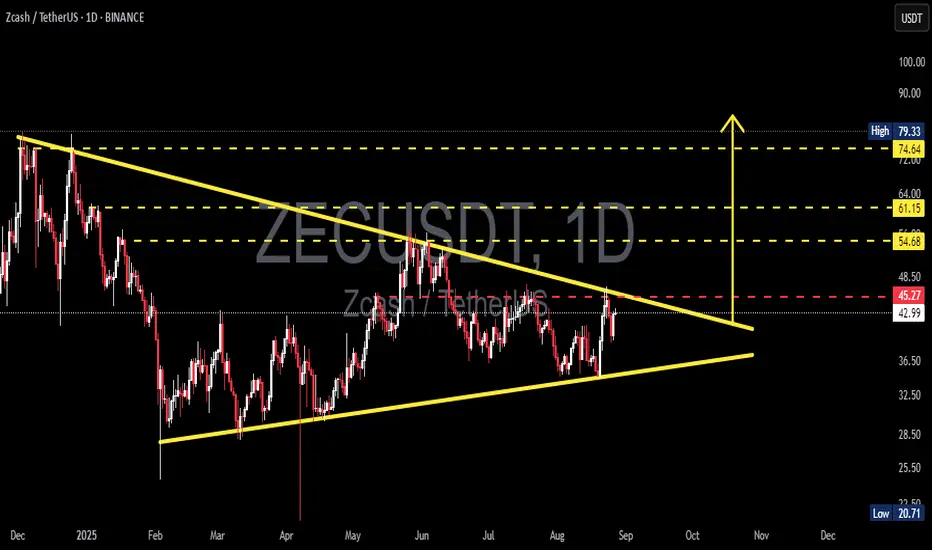
On the daily chart, ZEC/USDT is forming a symmetrical triangle. This structure is characterized by:
Lower Highs → sellers continue to defend lower levels (descending resistance).
Higher Lows → buyers step in earlier each time (ascending support).
Both lines are converging, compressing volatility, and signaling that a major move is imminent. The apex of this triangle is projected around late September to early October 2025, meaning a breakout (up or down) is likely to occur before then.
---
📈 Bullish Scenario (Upside Breakout)
If ZEC manages to break and close above 45–48 (red dashed line + descending resistance), especially with rising volume, it would confirm a bullish breakout.
➡️ Potential upside targets:
🎯 Target 1: 54.68 (+27%)
🎯 Target 2: 61.15 (+42%)
🎯 Target 3: 74.64 (+73%)
Such a breakout often sparks sustained rallies, especially if the broader crypto market sentiment aligns.
---
📉 Bearish Scenario (Downside Breakdown)
If ZEC fails to break resistance and instead closes below ~36.50 (ascending support), downside momentum could accelerate.
➡️ Potential downside targets:
🎯 Target 1: 36.50 (first support, −15%)
🎯 Target 2: 32.50 (major support, −24%)
🎯 Target 3: 20.71 (historical low, −52%)
This would indicate weakness and could open the door for deeper declines toward multi-month lows.
---
⚖️ Key Takeaways
The symmetrical triangle is a neutral but powerful pattern → direction will depend on the breakout.
Always wait for confirmation (daily close + volume spike) before committing.
Beware of false breakouts — a retest of the breakout zone is often a safer entry.
Risk management is crucial: protect capital with stop-loss and proper position sizing.
👉 In short: ZEC is approaching a make-or-break moment. Breakout to the upside could fuel a strong rally, while a breakdown could trigger heavy selling pressure.
#ZECUSDT #Zcash #CryptoAnalysis #Breakout #SymmetricalTriangle #Altcoins #TechnicalAnalysis #PriceAction
✅ Get Free Signals! Join Our Telegram Channel Here: t.me/TheCryptoNuclear
✅ Twitter: twitter.com/crypto_nuclear
✅ Join Bybit : partner.bybit.com/b/nuclearvip
✅ Benefits : Lifetime Trading Fee Discount -50%
✅ Twitter: twitter.com/crypto_nuclear
✅ Join Bybit : partner.bybit.com/b/nuclearvip
✅ Benefits : Lifetime Trading Fee Discount -50%
Declinazione di responsabilità
Le informazioni e le pubblicazioni non sono intese come, e non costituiscono, consulenza o raccomandazioni finanziarie, di investimento, di trading o di altro tipo fornite o approvate da TradingView. Per ulteriori informazioni, consultare i Termini di utilizzo.