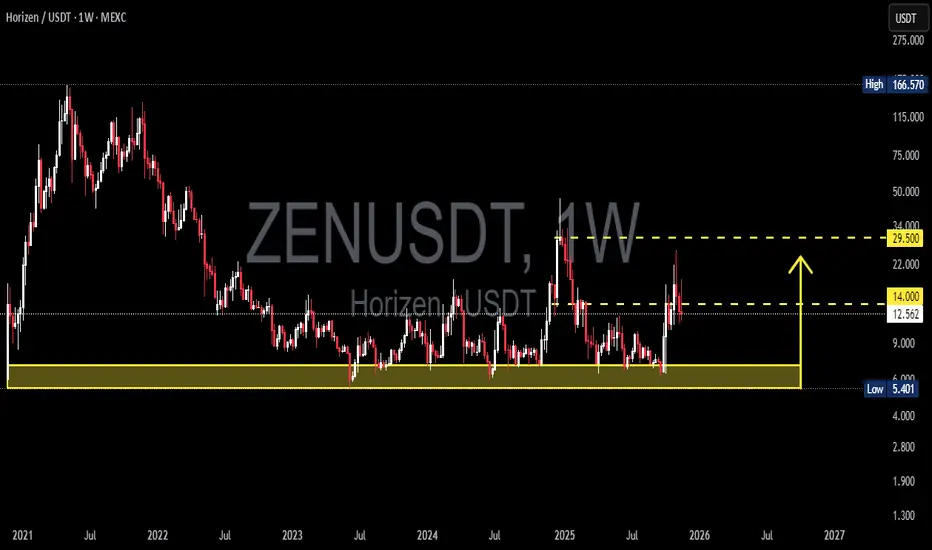
ZENUSDT is now sitting at the most critical point in its multi-year structure.
Since 2022, every major move—every drop, every rebound—has returned to the same zone:
the accumulation base at 7 – 5.4, highlighted in yellow.
This isn’t just support.
This is the foundation of the entire long-term market cycle, a level that continues to hold despite multiple tests and high volatility.
Buyers have consistently defended this zone, suggesting strong long-term interest from deep-pocket participants.
Now, the structure is shifting:
Price has rebounded again and is pressing toward the key resistance at 14.0 — the level that decides whether ZEN stays trapped in its multi-year range… or begins a full trend reversal cycle.
A weekly breakout above 14.0 could unlock the path toward the next major liquidity zone at 29.5, created by the explosive vertical spike in 2025.
This chart is at a turning point.
---
📌 Major Pattern Highlights
1. Multi-Year Accumulation Base (7 – 5.4)
The strongest support on the chart; every deep wick has been absorbed here.
2. Volatility Spike & Imbalance (2025)
The breakout created a liquidity vacuum toward 29.5 — price is now attempting to re-approach that zone.
3. Compression Into Resistance (14.0)
A series of small higher-lows building pressure beneath the resistance.
This kind of coil structure often leads to an explosive breakout.
4. High-Timeframe Pendulum Range Reversal
The failure to make new lows often signals energy building for an upside expansion.
---
🟩 Bullish Scenario
Bullish confirmation = weekly close above 14.0.
If this happens:
Primary target: 29.5
(major supply zone + liquidity pool from the 2025 spike)
This zone has very little structural resistance → allowing for fast upward movement.
Potential shift into a mid-term bullish trend.
Important:
The breakout must show a strong candle body, not a wick-only touch.
---
🟥 Bearish Scenario
Bearish conditions only become valid if: Price closes weekly back below 7.0 — especially below 5.4.
If that occurs:
The long-term bullish structure collapses.
Market opens the door to new lows.
Sellers regain full control, marking the end of the accumulation story.
In simple terms:
5.4 is ZEN’s long-term survival level.
---
This chart represents a clash between multi-year accumulation and the leftover supply from the 2025 liquidity spike.
And right now, price sits exactly at the decision zone:
Will ZEN finally escape its 3-year sideways prison…
or get dragged back into the bottom range once again?
The next few weekly candles will shape the entire trend for Q1–Q2 2026.
#ZENUSDT #Horizen #CryptoTA #TechnicalAnalysis #WeeklyChart
#AccumulationZone #BreakoutSetup #MarketStructure
#LiquidityLevels #CryptoOutlook
✅ Get Free Signals! Join Our Telegram Channel Here: t.me/TheCryptoNuclear
✅ Twitter: twitter.com/crypto_nuclear
✅ Join Bybit : partner.bybit.com/b/nuclearvip
✅ Benefits : Lifetime Trading Fee Discount -50%
✅ Twitter: twitter.com/crypto_nuclear
✅ Join Bybit : partner.bybit.com/b/nuclearvip
✅ Benefits : Lifetime Trading Fee Discount -50%
Declinazione di responsabilità
Le informazioni e le pubblicazioni non sono intese come, e non costituiscono, consulenza o raccomandazioni finanziarie, di investimento, di trading o di altro tipo fornite o approvate da TradingView. Per ulteriori informazioni, consultare i Termini di utilizzo.