I'm observing a potential bottom formation on 
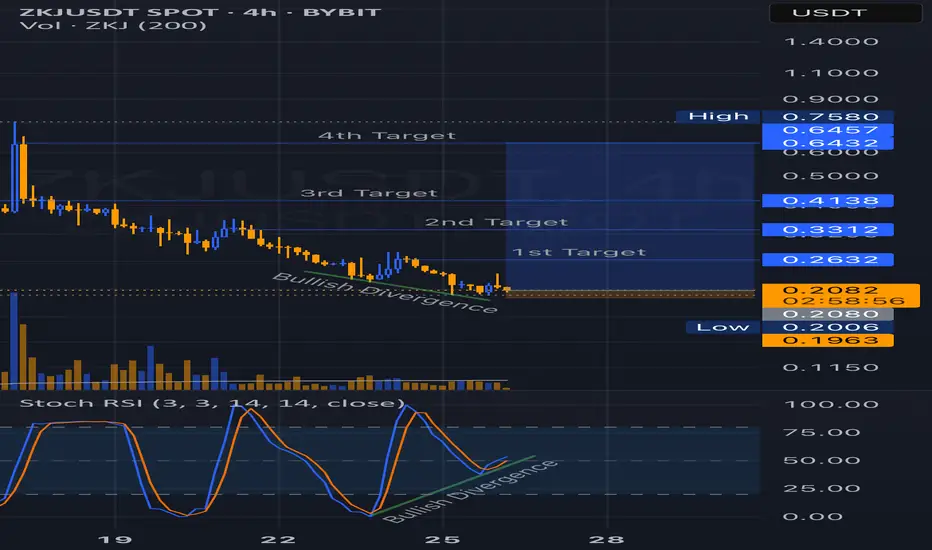
 ZKJUSDT 4H chart, supported by a clear bullish divergence between price action and the Stochastic RSI.
Price has been making lower lows, while the Stoch RSI is showing higher lows — indicating a possible momentum shift. This divergence suggests that selling pressure may be weakening and a potential reversal could be near.
I've marked 4 target levels based on previous structure and Fibonacci zones:
1st Target: 0.2632
2nd Target: 0.3312
3rd Target: 0.4138
4th Target: 0.6432 - 0.6457
Key support zone lies around 0.1963 - 0.2080.
Invalidation if price breaks below this support range.
Not financial advice. Always do your own research!
Declinazione di responsabilità
Le informazioni ed i contenuti pubblicati non costituiscono in alcun modo una sollecitazione ad investire o ad operare nei mercati finanziari. Non sono inoltre fornite o supportate da TradingView. Maggiori dettagli nelle Condizioni d'uso.
Declinazione di responsabilità
Le informazioni ed i contenuti pubblicati non costituiscono in alcun modo una sollecitazione ad investire o ad operare nei mercati finanziari. Non sono inoltre fornite o supportate da TradingView. Maggiori dettagli nelle Condizioni d'uso.