OPEN-SOURCE SCRIPT
Aggiornato [blackcat] L3 Trendmaster X
OVERVIEW
The [blackcat] L3 Trendmaster X is an advanced trend-following indicator meticulously crafted to assist traders in identifying and capitalizing on market trends. This sophisticated tool integrates multiple technical factors, including Average True Range (ATR), volume dynamics, and price spreads, to deliver precise buy and sell signals. By plotting dynamic trend bands directly onto the chart, it offers a comprehensive visualization of potential trend directions, enabling traders to make informed decisions swiftly and confidently 📊↗️.
FEATURES
Customizable Input Parameters: Tailor the indicator to match your specific trading needs with adjustable settings:
Trendmaster X Multiplier: Controls the sensitivity of the ATR-based levels.
Trendmaster X Period: Defines the period over which the ATR is calculated.
Window Length: Specifies the length of the moving window for standard deviation calculations.
Volume Averaging Length: Determines how many periods are considered for averaging volume.
Volatility Factor: Adjusts the impact of volatility on the trend bands.
Core Technical Metrics:
Dynamic Range: Measures the range between high and low prices within each bar.
Candle Body Size: Evaluates the difference between open and close prices.
Volume Average: Assesses the cumulative On-Balance Volume relative to the dynamic range.
Price Spread: Computes the standard deviation of the price ranges over a specified window.
Volatility Factor: Incorporates volatility into the calculation of trend bands.
Advanced Trend Bands Calculation:
Upper Level: Represents potential resistance levels derived from the ATR multiplier.
Lower Level: Indicates possible support levels using the same ATR multiplier.
High Band and Low Band: Dynamically adjust to reflect current trend directions, offering a clear view of market sentiment.
Visual Representation:
Plots distinct green and red trend lines representing bullish and bearish trends respectively.
Fills the area between these trend lines and the middle line for enhanced visibility.
Displays clear buy ('B') and sell ('S') labels on the chart for immediate recognition of trading opportunities 🏷️.
Alert System:
Generates real-time alerts when buy or sell conditions are triggered, ensuring timely action.
Allows customization of alert messages and frequencies to align with individual trading strategies 🔔.
HOW TO USE
Adding the Indicator:
Open your TradingView platform and navigate to the "Indicators" section.
Search for "[blackcat] L3 Trendmaster X" and add it to your chart.
Adjusting Settings:
Fine-tune the input parameters according to your preferences and trading style.
For example, increase the Trendmaster X Multiplier for higher sensitivity during volatile markets.
Decrease the Window Length for shorter-term trend analysis.
Monitoring Trends:
Observe the plotted trend bands and labels on the chart.
Look for buy ('B') labels at potential support levels and sell ('S') labels at resistance levels.
Setting Up Alerts:
Configure alerts based on the generated buy and sell signals.
Choose notification methods (e.g., email, SMS) and set alert frequencies to stay updated without constant monitoring 📲.
Combining with Other Tools:
Integrate the Trendmaster X with other technical indicators like Moving Averages or RSI for confirmation.
Utilize fundamental analysis alongside the indicator for a holistic approach to trading.
Backtesting and Optimization:
Conduct thorough backtests on historical data to evaluate performance.
Optimize parameters based on backtest results to enhance accuracy and reliability.
Real-Time Application:
Apply the optimized settings to live charts and monitor real-time signals.
Execute trades based on confirmed signals while considering risk management principles.
LIMITATIONS
Market Conditions: The indicator might produce false signals in highly volatile or sideways-trending markets due to increased noise and lack of clear direction 🌪️.
Complementary Analysis: Traders should use this indicator in conjunction with other analytical tools to validate signals and reduce the likelihood of false positives.
Asset-Specific Performance: Effectiveness can vary across different assets and timeframes; therefore, testing on diverse instruments is recommended.
NOTES
Data Requirements: Ensure adequate historical data availability for accurate calculations and reliable signal generation.
Demo Testing: Thoroughly test the indicator on demo accounts before deploying it in live trading environments to understand its behavior under various market scenarios.
Parameter Customization: Regularly review and adjust parameters based on evolving market conditions and personal trading objectives.
Note di rilascio
OVERVIEWThe L3 Trendmaster X is a sophisticated trading indicator designed to identify directional trends and generate actionable signals. By analyzing price action, volatility, and volume dynamics, it creates dynamic upper/lower trend bands that adapt to market conditions. This script provides visual cues for buying/selling opportunities, automated alerts, and customizable parameters to suit different trading strategies. It’s ideal for scalpers and swing traders looking to capitalize on intraday momentum shifts.
FEATURES
📈 Dynamic Trend Bands: Adjusts automatically based on volatility (ATR multiplier) and price spread metrics
🔍 Volume-Weighted Analysis: Integrates OBV and candle body size to detect volume-driven trends
🔄 Directional Signals: Highlights upward/downward trends with colored bands
💡 Alert System: Generates "Buy" and "Sell" alerts via crossover logic between trend states
✅ Customizable Parameters:
ATR period/multiplier
Window lengths for volatility calculation
Volume averaging settings
HOW TO USE
1️⃣ Installation:
Copy-paste script into TradingView chart
Select timeframe (works best on 4H/ Daily charts)
2️⃣ Parameter Tuning:
atrMultiplier: Increase for wider bands (0.1 increments)
windowLength: Longer periods smooth volatility calculation
volumeLength: Tune the EMA smoothing for volume-price trend
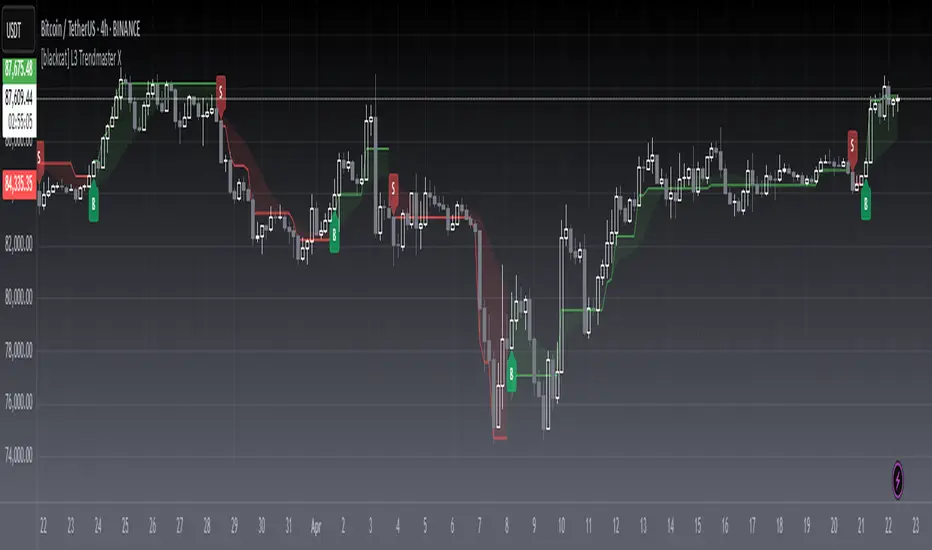
3️⃣ Interpretation:
Green band: Uptrend zone
Red band: Downtrend zone
Look for reversals when bands contract/narrow
4️⃣ Signals:
Blue "B" label: Buy signal (down trend turning up)
Red "S" label: Sell signal (up trend turning down)
LIMITATIONS
⚠️ Volatility spikes may cause false signals during high-impact events
⏰ Best suited for trending markets; choppy environments reduce effectiveness
🔍 Requires manual verification during critical price levels
NOTES
Works optimally in trending markets with defined directionality
Test parameter combinations on historical data before live trading
Consider adding stop-loss orders as per your risk tolerance strategy
Script open-source
Nello spirito di TradingView, l'autore di questo script lo ha reso open source, in modo che i trader possano esaminarne e verificarne la funzionalità. Complimenti all'autore! Sebbene sia possibile utilizzarlo gratuitamente, ricordiamo che la ripubblicazione del codice è soggetta al nostro Regolamento.
Avoid losing contact!Don't miss out! The first and most important thing to do is to join my Discord chat now! Click here to start your adventure: discord.com/invite/ZTGpQJq 防止失联,请立即行动,加入本猫聊天群: discord.com/invite/ZTGpQJq
Declinazione di responsabilità
Le informazioni e le pubblicazioni non sono intese come, e non costituiscono, consulenza o raccomandazioni finanziarie, di investimento, di trading o di altro tipo fornite o approvate da TradingView. Per ulteriori informazioni, consultare i Termini di utilizzo.